
diff options
| author | Tina Luedtke <kickoke@users.noreply.github.com> | 2022-01-18 14:38:15 -0800 |
|---|---|---|
| committer | GitHub <noreply@github.com> | 2022-01-18 14:38:15 -0800 |
| commit | bca7c55d8735cf152ae676ee0c854da0b1e245d2 (patch) | |
| tree | 177d3b8ede1f3a533bff63edaf8a354f5f303bb3 /docs | |
| parent | c73a7a06d3ca52bd206d2c5f070904894802f952 (diff) | |
Deleted duplicate getting started doc (#11978)
* Deleted duplicate getting started doc
We have three different Getting started docs and a Step-by-step guide which all have the same goal: to get the user started.
This page will be deleted for the following reasons:
- It isn't linked in the docs navigation
- The structure isn't very user friendly
- All information in the doc is documented elsewhere, too.
- There is almost no traffic on the page (25 views in the last 30 days). The general load of the netdata docs runs in the thousands.
* Amended links to point to real get started page
Diffstat (limited to 'docs')
| -rw-r--r-- | docs/getting-started.md | 236 | ||||
| -rw-r--r-- | docs/guides/monitor/pi-hole-raspberry-pi.md | 2 | ||||
| -rw-r--r-- | docs/guides/step-by-step/step-00.md | 2 |
3 files changed, 2 insertions, 238 deletions
diff --git a/docs/getting-started.md b/docs/getting-started.md deleted file mode 100644 index 2dd045f090..0000000000 --- a/docs/getting-started.md +++ /dev/null @@ -1,236 +0,0 @@ -<!-- -title: "Get started guide" -date: 2020-05-04 -custom_edit_url: https://github.com/netdata/netdata/edit/master/docs/getting-started.md ---> - -# Get started guide - -Thanks for trying the Netdata Agent! In this getting started guide, we'll quickly walk you through the first steps you -should take after installing the Agent. - -The Agent can collect thousands of metrics in real-time and use its database for long-term metrics storage without any -configuration, but there are some valuable things to know to get the most out of Netdata based on your needs. - -We'll skip right into some technical details, so if you're brand-new to monitoring the health and performance of systems -and applications, our [**step-by-step guide**](/docs/guides/step-by-step/step-00.md) might be a better fit. - -> If you haven't installed Netdata yet, visit the [installation instructions](/packaging/installer/README.md) for -> details, including our one-liner script, which automatically installs Netdata on almost all Linux distributions. - -## Access the dashboard - -Open up your web browser of choice and navigate to `http://NODE:19999`, replacing `NODE` with the IP address or hostname -of your Agent. Hit **Enter**. Welcome to Netdata! - - - -**What's next?**: - -- Read more about the [standard Netdata dashboard](/web/gui/README.md). -- Learn all the specifics of [using charts](/web/README.md#using-charts) or the differences between [charts, - context, and families](/web/README.md#charts-contexts-families). - -## Configuration basics - -Netdata primarily uses the `netdata.conf` file for custom configurations. - -On most systems, you can find that file at `/etc/netdata/netdata.conf`. - -> Some operating systems will place your `netdata.conf` at `/opt/netdata/etc/netdata/netdata.conf`, so check there if -> you find nothing at `/etc/netdata/netdata.conf`. - -The `netdata.conf` file is broken up into various sections, such as `[global]`, `[web]`, `[registry]`, and more. By -default, most options are commented, so you'll have to uncomment them (remove the `#`) for Netdata to recognize your -change. - -Once you save your changes, [restart Netdata](#start-stop-and-restart-netdata) to load your new configuration. - -**What's next?**: - -- [Change how long Netdata stores metrics](#change-how-long-netdata-stores-metrics) by changing the `page cache size` - and `dbengine disk space` settings in `netdata.conf`. -- Move Netdata's dashboard to a [different port](/web/server/README.md) or enable TLS/HTTPS - encryption. -- See all the `netdata.conf` options in our [daemon configuration documentation](/daemon/config/README.md). -- Run your own [registry](/registry/README.md#run-your-own-registry). - -## Change how long Netdata stores metrics - -Netdata can store long-term, historical metrics out of the box. A custom database uses RAM to store recent metrics, -ensuring dashboards and API queries are extremely responsive, while "spilling" historical metrics to disk. This -configuration keeps RAM usage low while allowing for long-term, on-disk metrics storage. - -You can tweak this custom _database engine_ to store a much larger dataset than your system's available RAM, -particularly if you allow Netdata to use slightly more RAM and disk space than the default configuration. - -Read our guide on [changing how long Netdata stores metrics](/docs/store/change-metrics-storage.md) to learn more and -use our the embedded database engine to figure out the exact settings you'll need to store historical metrics right in -the Agent's database. - -**What's next?**: - -- Learn more about the [memory requirements for the database - engine](/database/engine/README.md#memory-requirements) to understand how much RAM/disk space you should commit - to storing historical metrics. - -## Collect data from more sources - -When Netdata _starts_, it auto-detects dozens of **data sources**, such as database servers, web servers, and more. To -auto-detect and collect metrics from a service or application you just installed, you need to [restart -Netdata](#start-stop-and-restart-netdata). - -> There is one exception: When Netdata is running on the host (as in not in a container itself), it will always -> auto-detect containers and VMs. - -However, auto-detection only works if you installed the source using its standard installation procedure. If Netdata -isn't collecting metrics after a restart, your source probably isn't configured correctly. Look at the [external plugin -documentation](/collectors/plugins.d/README.md) to find the appropriate module for your source. Those pages will contain -more information about how to configure your source for auto-detection. - -Some modules, like `chrony`, are disabled by default and must be enabled manually for auto-detection to work. - -Once Netdata detects a valid source of data, it will continue trying to collect data from it. For example, if -Netdata is collecting data from an Nginx web server, and you shut Nginx down, Netdata will collect new data as soon as -you start the web server back up—no restart necessary. - -### Configure plugins - -Even if Netdata auto-detects your service/application, you might want to configure what, or how often, Netdata is -collecting data. - -Netdata uses **internal** and **external** plugins to collect data. Internal plugins run within the Netdata dæmon, while -external plugins are independent processes that send metrics to Netdata over pipes. There are also plugin -**orchestrators**, which are external plugins with one or more data collection **modules**. - -You can configure both internal and external plugins, along with the individual modules. There are many ways to do so: - -- In `netdata.conf`, `[plugins]` section: Enable or disable internal or external plugins with `yes` or `no`. -- In `netdata.conf`, `[plugin:XXX]` sections: Each plugin has a section for changing collection frequency or passing - options to the plugin. -- In `.conf` files for each external plugin: For example, at `/etc/netdata/python.d.conf`. -- In `.conf` files for each module : For example, at `/etc/netdata/python.d/nginx.conf`. - -It's complex, so let's walk through an example of the various `.conf` files responsible for collecting data from an -Nginx web server using the `nginx` module and the `python.d` plugin orchestrator. - -First, you can enable or disable the `python.d` plugin entirely in `netdata.conf`. - -```conf -[plugins] - # Enabled - python.d = yes - # Disabled - python.d = no -``` - -You can also configure the entire `python.d` external plugin via the `[plugin:python.d]` section in `netdata.conf`. -Here, you can change how often Netdata uses `python.d` to collect metrics or pass other command options: - -```conf -[plugin:python.d] - update every = 1 - command options = -``` - -The `python.d` plugin has a separate configuration file at `/etc/netdata/python.d.conf` for enabling and disabling -modules. You can use the `edit-config` script to edit the file, or open it with your text editor of choice: - -```bash -sudo /etc/netdata/edit-config python.d.conf -``` - -Finally, the `nginx` module has a configuration file called `nginx.conf` in the `python.d` folder. Again, use -`edit-config` or your editor of choice: - -```bash -sudo /etc/netdata/edit-config python.d/nginx.conf -``` - -In the `nginx.conf` file, you'll find additional options. The default works in most situations, but you may need to make -changes based on your particular Nginx setup. - -**What's next?**: - -- Look at the [full list of data collection modules](/collectors/COLLECTORS.md) - to configure your sources for auto-detection and monitoring. -- Improve the [performance](/docs/guides/configure/performance.md) of Netdata on low-memory systems. -- Configure `systemd` to expose [systemd services - utilization](/collectors/cgroups.plugin/README.md#monitoring-systemd-services) metrics automatically. -- [Reconfigure individual charts](/daemon/config/README.md#per-chart-configuration) in `netdata.conf`. - -## Health monitoring and alarms - -Netdata comes with hundreds of health monitoring alarms for detecting anomalies on production servers. If you're running -Netdata on a workstation, you might want to disable Netdata's alarms. - -Edit your `/etc/netdata/netdata.conf` file and set the following: - -```conf -[health] - enabled = no -``` - -If you want to keep health monitoring enabled, but turn email notifications off, edit your `health_alarm_notify.conf` -file with `edit-config`, or with the text editor of your choice: - -```bash -sudo /etc/netdata/edit-config health_alarm_notify.conf -``` - -Find the `SEND_EMAIL="YES"` line and change it to `SEND_EMAIL="NO"`. - -**What's next?**: - -- Follow the [health quickstart](/health/QUICKSTART.md) to locate and edit existing health entities, and then - create your own. -- See all the alarm options via the [health configuration reference](/health/REFERENCE.md). -- Add a new notification method, like [Slack](/health/notifications/slack/README.md). - -## Monitor multiple systems with Netdata Cloud - -If you have the Agent installed on multiple nodes, you can use Netdata Cloud in two ways: Monitor the health and -performance of an entire infrastructure via the Netdata Cloud web application, or use the Visited Nodes menu that's -built into every dashboard. - -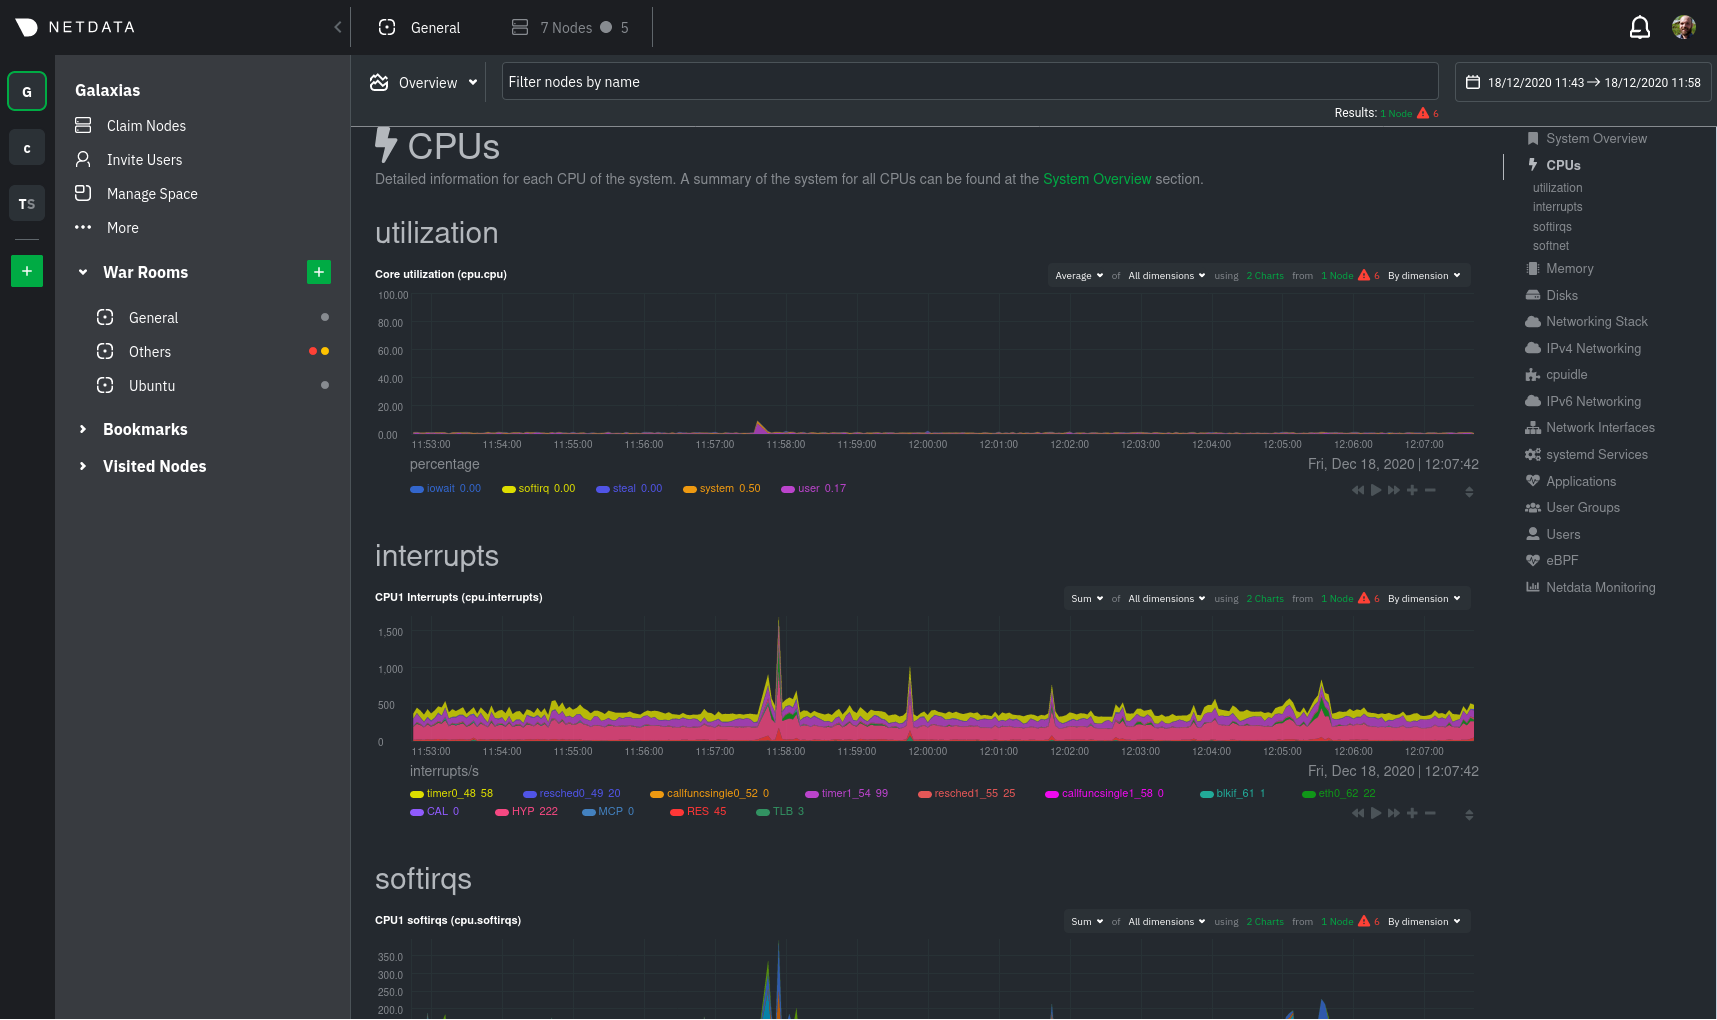 - -You can use these features together or separately—the decision is up to you and the needs of your infrastructure. - -**What's next?**: - -- Sign up for [Netdata Cloud](https://app.netdata.cloud). -- Read the [infrastructure monitoring quickstart](/docs/quickstart/infrastructure.md). -- Better understand how the Netdata Agent connects securely to Netdata Cloud with [connection process](/claim/README.md) and - [Agent-Cloud link](/aclk/README.md) documentation. - -## Start, stop, and restart Netdata - -When you install Netdata, it's configured to start at boot, and stop and restart/shutdown. You shouldn't need to start -or stop Netdata manually, but you will probably need to restart Netdata at some point. - -- To **start** Netdata, open a terminal and run `sudo systemctl start netdata`. -- To **stop** Netdata, run `sudo systemctl stop netdata`. -- To **restart** Netdata, run `sudo systemctl restart netdata`. - -See our doc on [starting, stopping, and restarting](/docs/configure/start-stop-restart.md) the Netdata Agent for -details. - -## What's next? - -Even after you've configured `netdata.conf`, tweaked alarms, learned the basics of performance troubleshooting, and -connected all your systems in Netdata Cloud or added them to the Visited nodes menu, you've just gotten started with -Netdata. - -Take a look at some more advanced features and configurations: - -- Centralize Netdata metrics from many systems with [streaming](/streaming/README.md) -- Enable long-term archiving of Netdata metrics via [exporting engine](/exporting/README.md) to time-series databases. -- Improve security by putting Netdata behind an [Nginx proxy with SSL](/docs/Running-behind-nginx.md). - -Or, learn more about how you can contribute to [Netdata core](/README.md#contribute) or our -[documentation](/docs/contributing/contributing-documentation.md)! - -[](<>) diff --git a/docs/guides/monitor/pi-hole-raspberry-pi.md b/docs/guides/monitor/pi-hole-raspberry-pi.md index 8ac25b8cb1..4147ca9769 100644 --- a/docs/guides/monitor/pi-hole-raspberry-pi.md +++ b/docs/guides/monitor/pi-hole-raspberry-pi.md @@ -100,7 +100,7 @@ part of your system might affect another. action](https://user-images.githubusercontent.com/1153921/80827388-b9fee100-8b98-11ea-8f60-0d7824667cd3.gif) If you're completely new to Netdata, look at our [step-by-step guide](/docs/guides/step-by-step/step-00.md) for a -walkthrough of all its features. For a more expedited tour, see the [get started guide](/docs/getting-started.md). +walkthrough of all its features. For a more expedited tour, see the [get started guide](/docs/get-started.md). ### Enable temperature sensor monitoring diff --git a/docs/guides/step-by-step/step-00.md b/docs/guides/step-by-step/step-00.md index 106571915e..0a49defe3b 100644 --- a/docs/guides/step-by-step/step-00.md +++ b/docs/guides/step-by-step/step-00.md @@ -17,7 +17,7 @@ completely new to Netdata, or have never tried health monitoring/performance tro guide is perfect for you. If you have monitoring experience, or would rather get straight into configuring Netdata to your needs, you can jump -straight into code and configurations with our [getting started guide](/docs/getting-started.md). +straight into code and configurations with our [getting started guide](/docs/get-started.md). > This guide contains instructions for Netdata installed on a Linux system. Many of the instructions will work on > other supported operating systems, like FreeBSD and macOS, but we can't make any guarantees. |