
diff options
| author | Fotis Voutsas <fotis@netdata.cloud> | 2023-02-28 21:07:22 +0200 |
|---|---|---|
| committer | GitHub <noreply@github.com> | 2023-02-28 11:07:22 -0800 |
| commit | ec030f924bd150955935f4807519adf30929f6ef (patch) | |
| tree | 60b438f5adefea7fac848eeaaefa45adbefcc93d /docs | |
| parent | ecb91a70815b26bab195b6d961cb848c6e25b870 (diff) | |
Fix broken links (#14634)
* fix broken link
* fix broken links
Diffstat (limited to 'docs')
| -rw-r--r-- | docs/cloud/alerts-notifications/add-webhook-notification-configuration.md | 2 | ||||
| -rw-r--r-- | docs/cloud/insights/metric-correlations.md | 6 |
2 files changed, 2 insertions, 6 deletions
diff --git a/docs/cloud/alerts-notifications/add-webhook-notification-configuration.md b/docs/cloud/alerts-notifications/add-webhook-notification-configuration.md index 5f244cf657..0140c30fdb 100644 --- a/docs/cloud/alerts-notifications/add-webhook-notification-configuration.md +++ b/docs/cloud/alerts-notifications/add-webhook-notification-configuration.md @@ -230,5 +230,5 @@ def webhook_challenge(): #### Related topics - [Alerts Configuration](https://github.com/netdata/netdata/blob/master/health/README.md) -- [Alert Notifications](https://github.com/netdata/netdata/blob/master/docs/cloud/alerts-notifications/notifications.mdx) +- [Alert Notifications](https://github.com/netdata/netdata/blob/master/docs/cloud/alerts-notifications/notifications.md) - [Manage notification methods](https://github.com/netdata/netdata/blob/master/docs/cloud/alerts-notifications/manage-notification-methods.md) diff --git a/docs/cloud/insights/metric-correlations.md b/docs/cloud/insights/metric-correlations.md index 66fd1903fd..7eb7d17bc5 100644 --- a/docs/cloud/insights/metric-correlations.md +++ b/docs/cloud/insights/metric-correlations.md @@ -55,7 +55,7 @@ Behind the scenes, Netdata will aggregate the raw data as needed such that arbit Netdata is different from typical observability agents since, in addition to just collecting raw metric values, it will by default also assign an "[Anomaly Bit](/docs/agent/ml#anomaly-bit)" related to each collected metric each second. This bit will be 0 for "normal" and 1 for "anomalous". This means that each metric also natively has an "[Anomaly Rate](/docs/agent/ml#anomaly-rate)" associated with it and, as such, MC can be run against the raw metric values or their corresponding anomaly rates. -**Note**: Read more [here](https://github.com/netdata/netdata/blob/master/docs/guides/monitor/anomaly-detection.md) to learn more about the native anomaly detection features within netdata. +**Note**: Read more [here](https://github.com/netdata/netdata/blob/master/ml/README.md) to learn more about the native anomaly detection features within netdata. - `Metrics` - Run MC on the raw metric values. - `Anomaly Rate` - Run MC on the corresponding anomaly rate for each metric. @@ -83,7 +83,3 @@ Should you still want to, disabling nodes for Metric Correlation on the agent is - `Volume` might favour picking up more sparse metrics that were relatively flat and then came to life with some spikes (or vice versa). This is because for such metrics that just don't have that many different values in them, it is impossible to construct a cumulative distribution that can then be compared. So `Volume` might be useful in spotting examples of metrics turning on or off. 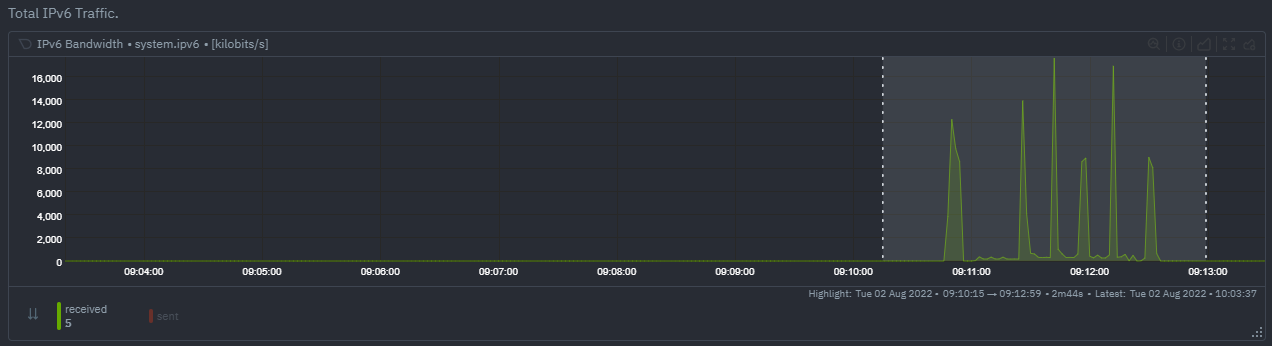 - `KS2` since it relies on the full distribution might be better at highlighting more complex changes that `Volume` is unable to capture. For example a change in the variation of a metric might be picked up easily by `KS2` but missed (or just much lower scored) by `Volume` since the averages might remain not all that different between baseline and highlight even if their variance has changed a lot. 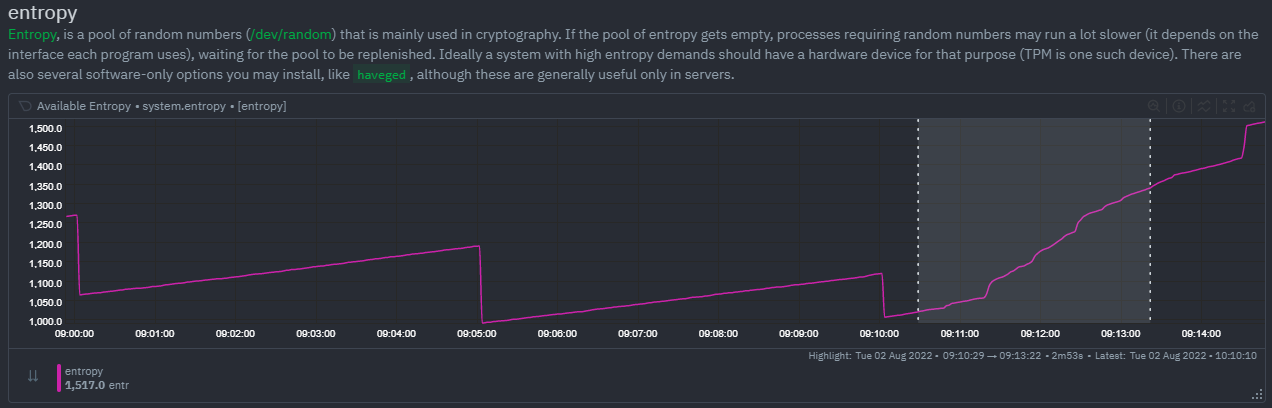 - Use `Volume` and `Anomaly Rate` together to ask what metrics have turned most anomalous from baseline to highlighted window. You can expand the embedded anomaly rate chart once you have results to see this more clearly. 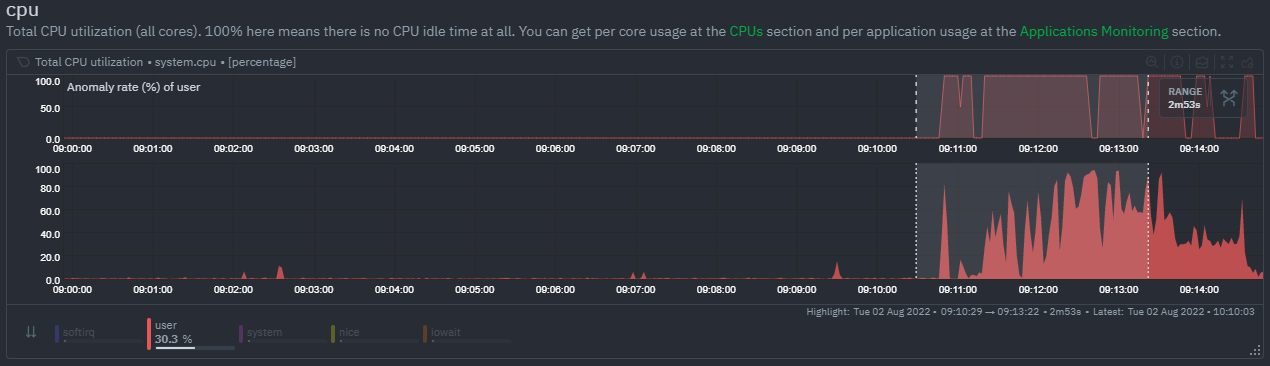 - -## What's next? - -You can read more about all the ML powered capabilities of Netdata [here](https://github.com/netdata/netdata/blob/master/docs/guides/monitor/anomaly-detection.md). If you aren't yet familiar with the power of Netdata Cloud's visualization features, check out the [Nodes view](https://github.com/netdata/netdata/blob/master/docs/cloud/visualize/nodes.md) and learn how to [build new dashboards](https://github.com/netdata/netdata/blob/master/docs/cloud/visualize/dashboards.md). |