
diff options
| author | Joel Hans <joel@netdata.cloud> | 2019-12-20 14:58:57 -0700 |
|---|---|---|
| committer | GitHub <noreply@github.com> | 2019-12-20 14:58:57 -0700 |
| commit | 9d754e8ac3530d68dd6a54a2b39668551d5d9956 (patch) | |
| tree | 240600d7969d8cdf4799c1bdf3585baf5e4f4dc1 /docs/step-by-step | |
| parent | 6fcb3e65f12d6c4b6171b37e9622adfbd8a112d9 (diff) | |
The step-by-step Netdata tutorial (#7489)
* Initial add
* Parts to steps
* Lots of fixes to tutorial steps, integration with docs
* Fixing broken links
* checklinks fix
* Add to sidebar
* Initial add
* Parts to steps
* Lots of fixes to tutorial steps, integration with docs
* Fixing broken links
* checklinks fix
* Add to sidebar
* Fixed link
* Added tutorial to homepage with styling
* Cleanup
* Few more fixes and improvements
* Final tweaks to last few steps
* Let nav items wrap
* Fixes for Austin and Andy
* Linter error
* Add text for Austin
* Text about charts not showing up
Diffstat (limited to 'docs/step-by-step')
| -rw-r--r-- | docs/step-by-step/step-00.md | 106 | ||||
| -rw-r--r-- | docs/step-by-step/step-01.md | 148 | ||||
| -rw-r--r-- | docs/step-by-step/step-02.md | 210 | ||||
| -rw-r--r-- | docs/step-by-step/step-03.md | 168 | ||||
| -rw-r--r-- | docs/step-by-step/step-04.md | 134 | ||||
| -rw-r--r-- | docs/step-by-step/step-05.md | 341 | ||||
| -rw-r--r-- | docs/step-by-step/step-06.md | 114 | ||||
| -rw-r--r-- | docs/step-by-step/step-07.md | 113 | ||||
| -rw-r--r-- | docs/step-by-step/step-08.md | 388 | ||||
| -rw-r--r-- | docs/step-by-step/step-09.md | 174 | ||||
| -rw-r--r-- | docs/step-by-step/step-10.md | 213 | ||||
| -rw-r--r-- | docs/step-by-step/step-99.md | 44 |
12 files changed, 2153 insertions, 0 deletions
diff --git a/docs/step-by-step/step-00.md b/docs/step-by-step/step-00.md new file mode 100644 index 0000000000..f8f95aed09 --- /dev/null +++ b/docs/step-by-step/step-00.md @@ -0,0 +1,106 @@ +# The step-by-step Netdata tutorial + +Welcome to Netdata! We're glad you're interested in our health monitoring and performance troubleshooting system. + +Because Netdata is entirely open-source software, you can use it free of charge, whether you want to monitor one or ten +thousand systems! All our code is hosted on [GitHub](https://github.com/netdata/netdata). + +This tutorial is designed to help you understand what Netdata is, what it's capable of, and how it'll help you make +faster and more informed decisions about the health and performance of your systems and applications. If you're +completely new to Netdata, or have never tried health monitoring/performance troubleshooting systems before, this +tutorial is perfect for you. + +If you have monitoring experience, or would rather get straight into configuring Netdata to your needs, you can jump +straight into code and configurations with our [getting started guide](../getting-started.md). + +> This tutorial contains instructions for Netdata installed on a Linux system. Many of the instructions will work on +> other supported operating systems, like FreeBSD and MacOS, but we can't make any guarantees. + +## Where to go if you need help + +No matter where you are in this Netdata tutorial, if you need help, head over to our [GitHub +repository](https://github.com/netdata/netdata/). That's where we collect questions from users, help fix their bugs, and +point people toward documentation that explains what they're having trouble with. + +Click on the **issues** tab to see all the conversations we're having with Netdata users. Use the search bar to find +previously-written advice for your specific problem, and if you don't see any results, hit the **New issue** button to +send us a question. + +Or, if that's too complicated, feel free to send this tutorial's author [an email](mailto:joel@netdata.cloud). + +## Before we get started + +Let's make sure you have Netdata installed on your system! + +> If you already installed Netdata, feel free to skip to [Step 1: Netdata's building blocks](step-01.md). + +The easiest way to install Netdata on a Linux system is our `kickstart.sh` one-line installer. Run this on your system +and let it take care of the rest. + +This script will install Netdata from source, keep it up to date with nightly releases, connects to the Netdata +[registry](../../registry/README.md), and sends [_anonymous statistics_](../anonymous-statistics.md) about how you use +Netdata. We use this information to better understand how we can improve the Netdata experience for all our users. + +```bash +bash <(curl -Ss https://my-netdata.io/kickstart.sh) +``` + +Once finished, you'll have Netdata installed, and you'll be set up to get _nightly updates_ to get the latest features, +improvements, and bugfixes. + +If this method doesn't work for you, or you want to use a different process, visit our [installation +documentation](../../packaging/installer/README.md) for details. + +## Netdata fundamentals + +[Step 1. Netdata's building blocks](step-01.md) + +In this introductory step, we'll talk about the fundamental ideas, philosophies, and UX decisions behind Netdata. + +[Step 2. Get to know Netdata's dashboard](step-02.md) + +Visit Netdata's dashboard to explore, manipulate charts, and check out alarms. Get your first taste of visual anomaly +detection. + +[Step 3. Monitor more than one system with Netdata](step-03.md) + +While the dashboard lets you quickly move from one agent to another, Netdata Cloud is our SaaS solution for monitoring +the health of many systems. We'll cover its features and the benefits of using Netdata Cloud on top of the dashboard. + +[Step 4. The basics of configuring Netdata](step-04.md) + +While Netdata can monitor thousands of metrics in real-time without any configuration, you may _want_ to tweak some +settings based on your system's resources. + +## Intermediate steps + +[Step 5. Health monitoring alarms and notifications](step-05.md) + +Learn how to tune, silence, and write custom alarms. Then enable notifications so you never miss a change in health +status or performance anomaly. + +[Step 6. Collect metrics from more services and apps](step-06.md) + +Learn how to enable/disable collection plugins and configure a collection plugin job to add more charts to your Netdata +dashboard and begin monitoring more apps and services, like MySQL, Nginx, MongoDB, and hundreds more. + +[Step 7. Netdata's dashboard in depth](step-07.md) + +Now that you configured your Netdata monitoring agent to your exact needs, you'll dive back into metrics snapshots, +updates, and the dashboard's settings. + +## Advanced steps + +[Step 8. Building your first custom dashboard](step-08.md) + +Using simple HTML, CSS, and JavaScript, we'll build a custom dashboard that displays essential information in any format +you choose. You can even monitor many systems from a single HTML file. + +[Step 9. Long-term metrics storage](step-09.md) + +Want to store lots of real-time metrics from Netdata? Tweak our custom database to your heart's content. Want to take +your Netdata metrics elsewhere? We're happy to help you archive data to Prometheus, MongoDB, TimescaleDB, and others. + +[Step 10. Set up a proxy](step-10.md) + +Run Netdata behind an Nginx proxy to improve performance, and enable TLS/HTTPS for better security. diff --git a/docs/step-by-step/step-01.md b/docs/step-by-step/step-01.md new file mode 100644 index 0000000000..fedf3ea0e2 --- /dev/null +++ b/docs/step-by-step/step-01.md @@ -0,0 +1,148 @@ +# Step 1. Netdata's building blocks + +Netdata is a distributed and real-time _health monitoring and performance troubleshooting toolkit_ for monitoring your +systems and applications. + +Because the monitoring agent is highly-optimized, you can install it all your physical systems, containers, IoT devices, +and edge devices without disrupting their core function. + +By default, and without configuration, Netdata delivers real-time insights into everything happening on the system, from +CPU utilization to packet loss on every network device. Netdata can also auto-detect metrics from hundreds of your +favorite services and applications, like MySQL/MariaDB, Docker, Nginx, Apache, MongoDB, and more. + +All metrics are automatically-updated, providing interactive dashboards that allow you to dive in, discover anomalies, +and figure out the root cause analysis of any issue. + +Best of all, Netdata is entirely free, open-source software! Solo developers and enterprises with thousands of systems +can both use it free of charge. We're hosted on [GitHub](https://github.com/netdata/netdata). + +Want to learn about the history of Netdata, and what inspired our CEO to build it in the first place, and where we're +headed? Read Costa's comprehensive blog post: _[Redefining monitoring with Netdata (and how it came to +be)](https://blog.netdata.cloud/posts/redefining-monitoring-netdata/)_. + +## What you'll learn in this step + +In the first step of the Netdata guide, you'll learn about: + +- [Netdata's core features](#netdatas-core-features) +- [Why you should use Netdata](#why-you-should-use-netdata) +- [How Netdata has complementary systems, not competitors](#how-netdata-has-complementary-systems-not-competitors) + +Let's get started! + +## Netdata's core features + +Netdata has only been around for a few years, but it's a complex piece of software. Here are just some of the features +we'll cover throughout this tutorial. + +- A sophisticated **dashboard**, which we'll cover in [step 2](step-02.md). The real-time, highly-granular dashboard, + with hundreds of charts, is your main source of information about the health and performance of your systems/ + applications. We designed the dashboard with anomaly detection and quick analysis in mind. We'll return to + dashboard-related topics in both [step 7](step-07.md) and [step 8](step-08.md). +- **Netdata Cloud** is our SaaS toolkit that helps Netdata users monitor the health and performance of entire + infrastructures, whether they are two or two thousand (or more!) systems. We'll cover Netdata Cloud in [step + 3](step-03.md). +- **No configuration necessary**. Without any configuration, you'll get thousands of real-time metrics and hundreds of + alarms designed by our community of sysadmin experts. But you _can_ configure Netdata in a lot of ways, some of + which we'll cover in [step 4](step-04.md). +- **Distributed, per-system installation**. Instead of centralizing metrics in one location, you install Netdata on + _every_ system, and each system is responsible for its metrics. Having distributed agents reduces cost and lets + Netdata run on devices with little available resources, such as IoT and edge devices, without affecting their core + purpose. +- **Sophisticated health monitoring** to ensure you always know when an anomaly hits. In [step 5](step-05.md), we dive + into how you can tune alarms, write your own alarm, and enable two types of notifications. +- **High-speed, low-resource collectors** that allow you to collect thousands of metrics every second while using only + a fraction of your system's CPU resources and a few MiB of RAM. +- **Long-term metrics storage**. With our new database engine, you can store days, weeks, or months of per-second + historical metrics. Or you can archive metrics to another database, like MongoDB or Prometheus. We'll cover all + these options in [step 9](step-09.md). + +## Why you should use Netdata + +Because you care about the health and performance of your systems and applications, and all of the awesome features we +just mentioned. And it's free! + +All these may be valid reasons, but let's step back and talk about Netdata's _principles_ for health monitoring and +performance troubleshooting. We have a lot of [complementary +systems](#how-netdata-has-complementary-systems-not-competitors), and we think there's a good reason why Netdata should +always be your first choice when troubleshooting an anomaly. + +We built Netdata on four principles. + +### Per-second data collection + +Our first principle is per-second data collection for all metrics. + +That matters because you can't monitor a 2-second service-level agreement (SLA) with 10-second metrics. You can't detect +quick anomalies if your metrics don't show them. + +How do we solve this? By decentralizing monitoring. Each node is responsible for collecting metrics, triggering alamrs, +and building dashboards locally, and we work hard to ensure it does each step (and others) with remarkable efficiency. +For example, Netdata can [collect 100,000 metrics](https://github.com/netdata/netdata/issues/1323) every second while +using only 9% of a single server-grade CPU core! + +By decentralizing monitoring and emphasizing speed at every turn, Netdata helps you scale your health monitoring and +performance troubleshooting to an infrastructure of every size. _And_ you get to keep per-second metrics. + +### Unlimited metrics + +We believe all metrics are fundamentally important, and all metrics should be available to the user. + +If you don't collect _all_ the metrics a system creates, you're only seeing part of the story. It's like saying you've +read a book after skipping all but the last ten pages. You only know the ending, not everything that leads to it. + +Most monitoring solutions exist to poke you when there's a problem, and then tell you to use a dozen different console +tools to find the root cause. Netdata prefers to give you every piece of information you might need to understand why an +anomaly happened. + +### Meaningful presentation + +We want every piece of Netdata's dashboard not only to look good and update every second, but also provide context as to +what you're looking at and why it matters. + +The principle of meaningful presentation is fundamental to our dashboard's user experience (UX). We could have put +charts in a grid or hidden some behind tabs or buttons. We instead chose to stack them vertically, on a single page, so +you can visually see how, for example, a jump in disk usage can also increase system load. + +Here's an example of a system undergoing a disk stress test: + +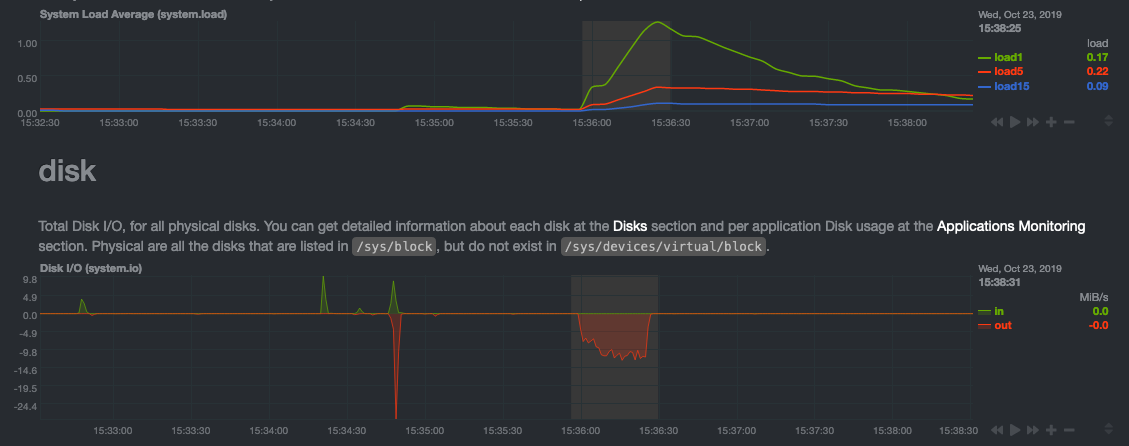 + +> For the curious, here's the command: `stress-ng --fallocate 4 --fallocate-bytes 4g --timeout 1m --metrics --verify +> --times`! + +### Immediate results + +Finally, Netdata should be usable from the moment you install it. + +As we've talked about, and as you'll learn in the following nine steps, Netdata comes installed with: + +- Auto-detected metrics +- Human-readable units +- Metrics that are structured into charts, families, and contexts +- Automatically generated dashboards +- Charts designed for visual anomaly detection +- Hundreds of pre-configured alarms + +By standardizing your monitoring infrastructure, Netdata tries to make at least one part of your administrative tasks +easy! + +## How Netdata has complementary systems, not competitors + +We'll cover this quickly, as you're probably eager to get on with using Netdata itself. + +We don't want to lock you in to using Netdata by itself, and forever. By supporting [archiving to +backends](../../backends/README.md) like Graphite, Prometheus, OpenTSDB, MongoDB, and others, you can use Netdata _in +conjunction_ with software that might seem like our competitors. + +We don't want to "wage war" with another monitoring solution, whether it's commercial, open-source, or anything in +between. We just want to give you all the metrics every second, and what you do with them next is your business, not +ours. Our mission is helping people create more extraordinary infrastructures! + +## What's next? + +We think it's imperative you understand why we built Netdata the way we did. But now that we have that behind us, let's +get right into that dashboard you've heard so much about. + +[Next: Get to know Netdata's dashboard →](step-02.md) diff --git a/docs/step-by-step/step-02.md b/docs/step-by-step/step-02.md new file mode 100644 index 0000000000..c9a0b120e5 --- /dev/null +++ b/docs/step-by-step/step-02.md @@ -0,0 +1,210 @@ +# Step 2. Get to know Netdata's dashboard + +Welcome to Netdata proper! Now that you understand how Netdata works, how it's built, and why we built it, you can start +working with the dashboard directly. + +This step-by-step guide assumes you've already installed Netdata on a system of yours. If you haven't yet, hop back over +to ["step 0"](step-00.md#before-we-get-started) for information about our one-line installer script. Or, view the +[installation docs](../../packaging/installer) to learn more. Once you have Netdata installed, you can hop back over +here and dig in. + +## What you'll learn in this step + +In this step of the Netdata guide, you'll learn how to: + +- [Visit and explore the dashboard](#visit-and-explore-the-dashboard) +- [Explore available charts using menus](#explore-available-charts-using-menus) +- [Read the descriptions accompanying charts](#read-the-descriptions-accompanying-charts) +- [Interact with charts](#interact-with-charts) +- [See raised alarms and the alarm log](#see-raised-alarms-and-the-alarm-log) + +Let's get started! + +## Visit and explore the dashboard + +Netdata's dashboard is where you interact with your system's metrics. Time to open it up and start exploring. Open up +your browser of choice. + +If you installed Netdata on the same system you're using to open your browser, navigate to `http://localhost:19999/`. + +If you installed Netdata on a remote system, navigate to `http://HOST:19999/` after replacing `HOST` with the IP address +of that system. To connect to a virtual private server (VPS), for example, you might navigate to +`http://203.0.113.0:19999`. We'll learn more on monitoring remote systems and [multiple systems](step-03.md) +later on. + +> From here on out in this tutorial, we'll refer to the address you use to view your dashboard as `HOST`. Be sure to +> replace it with either `localhost` or the IP address as needed. + +Hit `Enter`. Welcome to Netdata! + +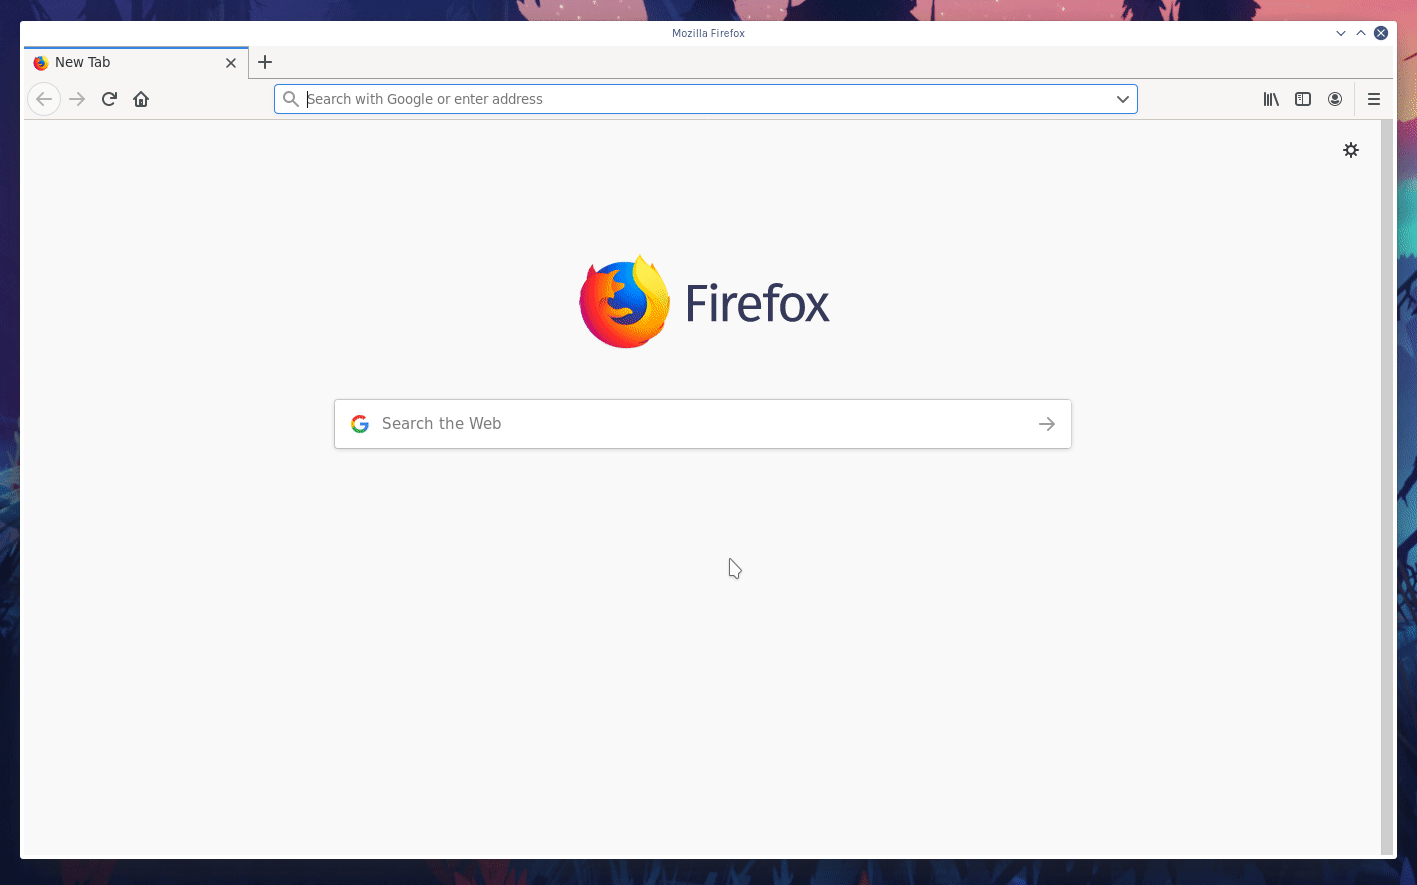 + +## Explore available charts using menus + +**Menus** are located on the right-hand side of the Netdata dashboard. You can use these to navigate to the +charts you're interested in. + +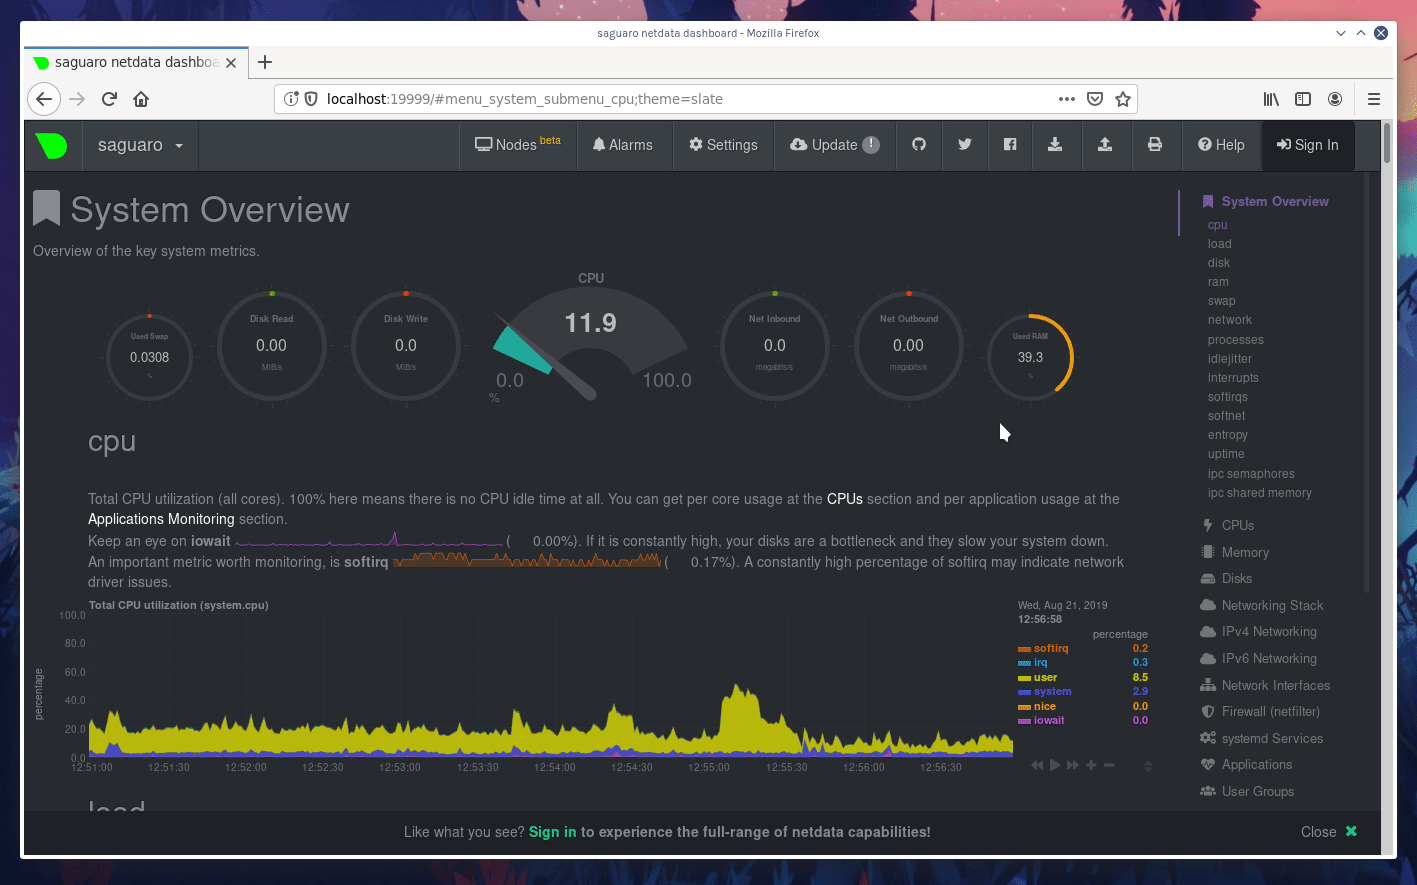 + +Netdata shows all its charts on a single page, so you can also scroll up and down using the mouse wheel, your +touchscreen/touchpad, or the scrollbar. + +Both menus and the items displayed beneath them, called **submenus**, are populated automatically by Netdata based on +what it's collecting. If you run Netdata on many different systems using different OS types or versions, the +menus and submenus may look a little different for each one. + +To learn more about menus, see our documentation about [navigating the standard +dashboard](../../web/gui/README.md#menus). + +> ❗ By default, Netdata only creates and displays charts if the metrics are _not zero_. So, you may be missing some +> charts, menus, and submenus if those charts have zero metrics. You can change this by changing the **Which dimensions +> to show?** setting to **All**. In addition, if you start Netdata and immediately load the dashboard, not all +> charts/menus/submenus may be displayed, as some collectors can take a while to initialize. + +## Read the descriptions accompanying charts + +Many charts come with a short description of what dimensions the chart is displaying and why they matter. + +For example, here's the description that accompanies the **swap** chart. + +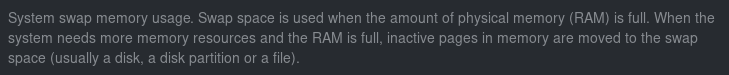 + +If you're new to health monitoring and performance troubleshooting, we recommend you spend some time reading these +descriptions and learning more at the pages linked above. + +## Understand charts, dimensions, families, and contexts + +A **chart** is an interactive visualization of one or more collected/calculated metrics. You can see the name (also +known as its unique ID) of a chart by looking at the top-left corner of a chart and finding the parenthesized text. On a +Linux system, one of the first charts on the dashboard will be the system CPU chart, with the name `system.cpu`: + + + +A **dimension** is any value that gets shown on a chart. The value can be raw data or calculated values, such as +percentages, aggregates, and more. Most charts will have more than one dimension, in which case it will display each in +a different color. Here, a `system.cpu` chart is showing many dimensions, such as `user`, `system`, `softirq`, `irq`, +and more. + +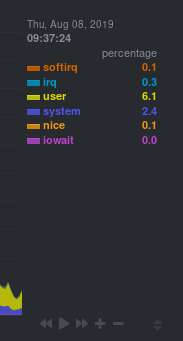 + +A **family** is _one_ instance of a monitored hardware or software resource that needs to be monitored and displayed +separately from similar instances. For example, if your system has multiple partitions, Netdata will create different +families for `/`, `/boot`, `/home`, and so on. Same goes for entire disks, network devices, and more. + +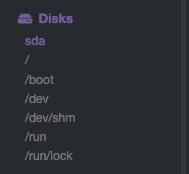 + +A **context** groups several charts based on the types of metrics being collected and displayed. For example, the +**Disk** section often has many contexts: `disk.io`, `disk.ops`, `disk.backlog`, `disk.util`, and so on. Netdata uses +this context to create individual charts and then groups them by family. You can always see the context of any chart by +looking at its name or hovering over the chart's date. + +It's important to understand these differences, as Netdata uses charts, dimensions, families, and contexts to create +health alarms and configure collectors. To read even more about the differences between all these elements of the +dashboard, and how they affect other parts of Netdata, read our [dashboards +documentation](../../web/README.md#charts-contexts-families). + +## Interact with charts + +We built Netdata to be a big sandbox for learning more about your systems and applications. Time to play! + +Netdata's charts are fully interactive. You can pan through historical metrics, zoom in and out, select specific +timeframes for further analysis, resize charts, and more. + +Best of all, Whenever you use a chart in this way, Netdata synchronizes all the other charts to match it. This even +applies across different Netdata agents if you connect them using the [**My nodes** menu](../../registry/README.md)! + +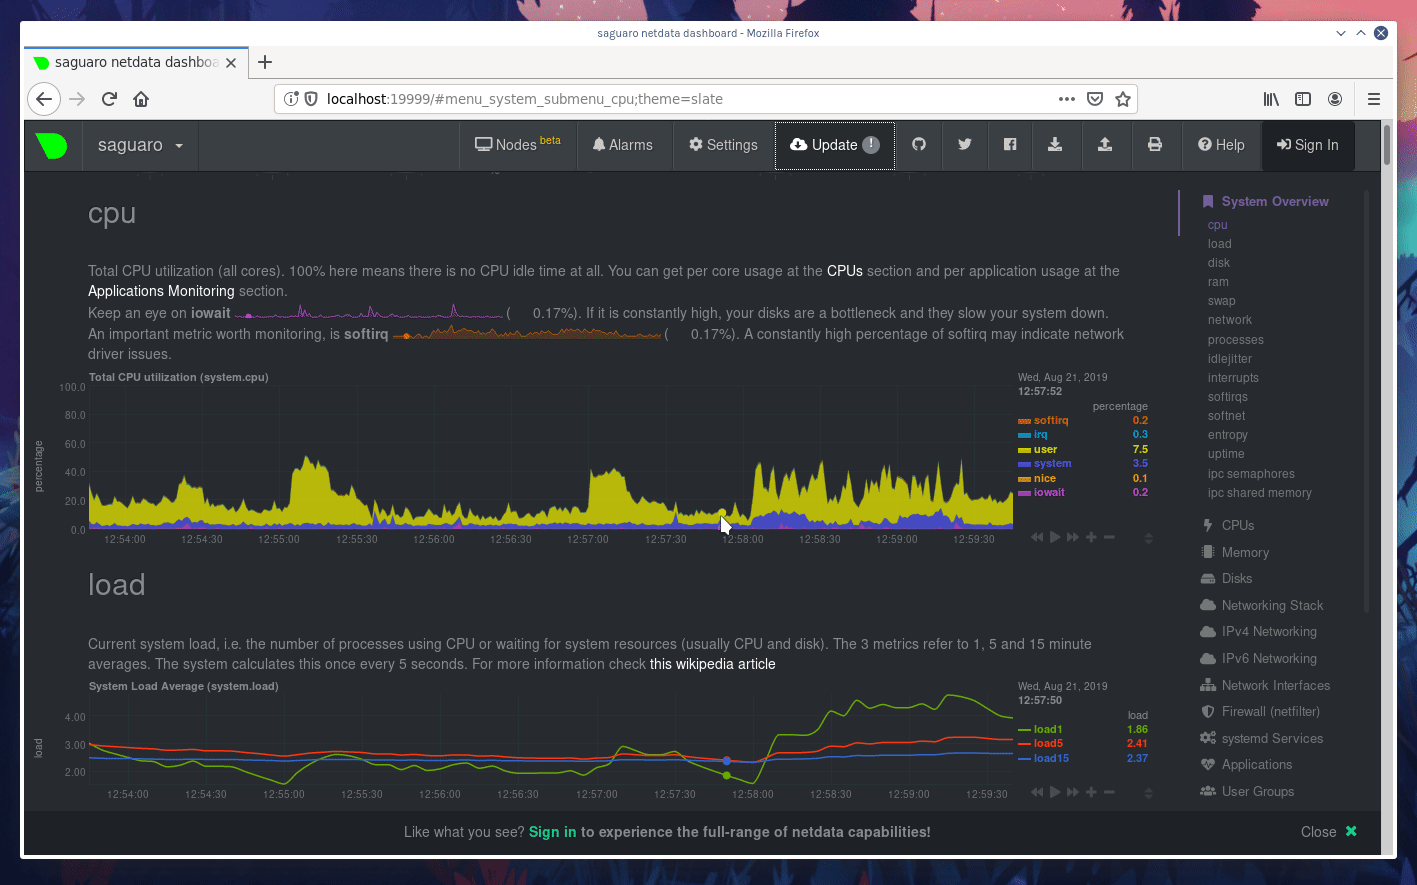 + +### Pan, zoom, highlight, and reset charts + +You can change how charts show their metrics in a few different ways, each of which have a few methods: + +| Change | Method #1 | Method #2 | Method #3 | +| ------------------------------------------------- | ----------------------------------- | --------------------------------------------------------- | ---------------------------------------------------------- | +| **Reset** charts to default auto-refreshing state | `double click` | `double tap` (touchpad/touchscreen) | | +| **Select** a certain timeframe | `ALT` + `mouse selection` | `⌘` + `mouse selection` (macOS) | | +| **Pan** forward or back in time | `click and drag` | `touch and drag` (touchpad/touchscreen) | | +| **Zoom** to a specific timeframe | `SHIFT` + `mouse selection` | | | +| **Zoom** in/out | `SHIFT`/`ALT` + `mouse scrollwheel` | `SHIFT`/`ALT` + `two-finger pinch` (touchpad/touchscreen) | `SHIFT`/`ALT` + `two-finger scroll` (touchpad/touchscreen) | + +These interactions can also be triggered using the icons on the bottom-right corner of every chart. They are, +respectively, `Pan Left`, `Reset`, `Pan Right`, `Zoom In`, and `Zoom Out`. + +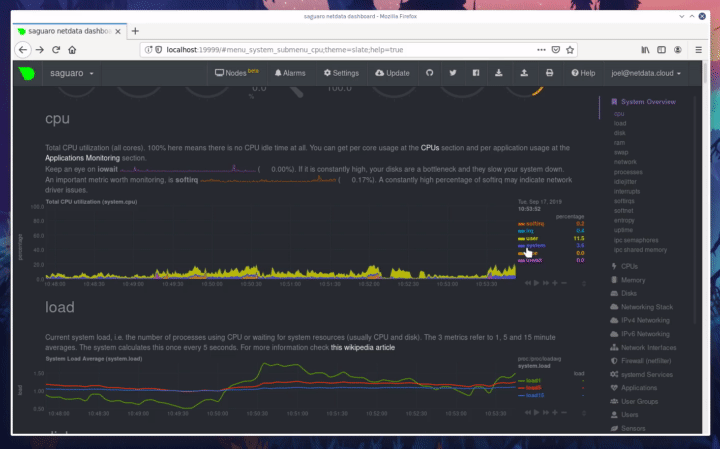 + +### Show and hide dimensions + +Each dimension can be hidden by clicking on it. Hiding dimensions simplifies the chart and can help you better discover +exactly which aspect of your system is behaving strangely. + +### Resize charts + +Additionally, resize charts by clicking-and-dragging the icon on the bottom-right corner of any chart. To restore the +chart to its original height, double-click the same icon. + + + +To learn more about other options and chart interactivity, read our [dashboard documentation](../../web/README.md). + +## See raised alarms and the alarm log + +Aside from performance troubleshooting, Netdata is designed to help you monitor the health of your systems and +applications. That's why every Netdata installation comes with dozens of pre-configured alarms that trigger alerts when +your system starts acting strangely. + +Find the **Alarms** button in the top navigation bring up a modal that shows currently raised alarms, all running +alarms, and the alarms log. + +Here is an example of raised `disk_space._` and `disk_space._home` alarms, followed by the full list and alarm log: + + + +Let's look at one of those raised alarms a little more in-depth. Here is a static screenshot: + + + +The alarm itself is named **disk - /**, and its context is `disk_space._`. Beneath that is an auto-updating badge that +shows the latest metric: 28.4% disk space usage. + +With the three icons beneath that and the **role** designation, you can **1)** scroll to the chart associated with this +raised alarm, **2)** copy a link to the badge to your clipboard, and **3)** copy the code to embed the badge onto +another web page using an `<embed>` element. + +The table on the right-hand side displays information about the alarm's configuration. + +In this example, Netdata triggers a warning alarm when any disk on the system is more than 20% full. Netdata triggers a +critical alarm when the disk is more than 30% full. + +The `calculation` field is the equation used to calculate those percentages, and the `check every` field specifies how +often Netdata should be calculating these metrics to see if the alarm should remain triggered. + +The `execute` field tells Netdata how to notify you about this alarm, and the `source` field lets you know where you can +find the configuration file, if you'd like to edit its configuration. + +We'll cover alarm configuration in more detail later in the tutorial, so don't worry about it too much for now! Right +now, it's most important that you understand how to see alarms, and parse their details, if and when they appear on your +system. + +## What's next? + +In this step of the Netdata tutorial, you learned how to: + +- Visit the dashboard +- Explore available charts (using the right-side menu) +- Read the descriptions accompanying charts +- Interact with charts +- See raised alarms and the alarm log + +Next, you'll learn how to monitor multiple nodes through the dashboard. + +[Next: Monitor more than one system with Netdata →](step-03.md) diff --git a/docs/step-by-step/step-03.md b/docs/step-by-step/step-03.md new file mode 100644 index 0000000000..460f43573a --- /dev/null +++ b/docs/step-by-step/step-03.md @@ -0,0 +1,168 @@ +# Step 3. Monitor more than one system with Netdata + +The Netdata agent is _distributed_ by design. That means each agent operates independently from any other, collecting +and creating charts only for the system you installed it on. We made this decision a long time ago to [improve security +and performance](step-01.md). + +You might be thinking, "So, now I have to remember all these IP addresses, and type them into my browser +manually, to move from one system to another? Maybe I should just make a bunch of bookmarks. What's a few more tabs +on top of the hundred I have already? 🤬" + +We get it. That's why we built [Netdata Cloud](../netdata-cloud/README.md), which connects many distributed agents +together for a seamless experience when monitoring multiple systems. + +All without remembering IPs or making a bunch of bookmarks. + +> If you're interested in streaming the metrics from one Netdata agent to another, that's unfortunately not part of this +> tutorial. You'll want to reference our [streaming documentation](../../streaming/README.md) when you're finished with +> these steps. + +Even if you don't have multiple systems right now, keep reading. The instructions to follow will show you how to test +out these features with Netdata demo servers. That way, you'll be able to experience one of Netdata's defining features +right away. + +## What you'll learn in this step + +In this step of the Netdata guid, we'll talk about the following: + +- [Why you should use Netdata Cloud](#why-use-netdata-cloud) +- [Add nodes to your Netdata Cloud account](#add-nodes-to-your-netdata-cloud-account) +- [Navigate between your nodes via the **My nodes** menu](#navigate-between-your-nodes-via-the-my-nodes-menu) +- [Try out the Nodes View](#try-out-the-nodes-view) + +## Why use Netdata Cloud? + +We built Netdata Cloud to give users a way to bridge the gap between many distributed agents running concurrently, all +without creating a centralized database for all your systems' metrics. + +> Read more: [_Introducing Netdata Cloud: our vision for distributed health and performance +> monitoring_](https://blog.netdata.cloud/posts/netdata-cloud-announcement/). + +Netdata Cloud gives you a better way to observe and take action on slowdowns, anomalies, or outages in your systems and +applications. It connects all your Netdata agents through your _web browser_, allowing you to move between different +nodes quickly and use the Nodes View to see a handful or hundreds of Netdata-monitored nodes on a single screen. + +If you're keeping tabs on multiple systems with Netdata, Netdata Cloud gives you all the benefits of a centralized +monitoring solution while distributing the workload to each agent. + +That makes Netdata Cloud both comprehensive and lightweight. The best of both worlds! + +And, better yet, Netdata Cloud doesn't store any of your system's metrics. It stores _metadata_ about the system's IP, +hostname, and a randomly-created GUID, and nothing else. Metrics are streamed from your systems directly to your _web +browser_. + +Essentially, your web browser hosts a SaaS application with all of Netdata Cloud's features embedded right into the +dashboard itself. + +## Add nodes to your Netdata Cloud account + +The best way to add nodes to your Netdata Cloud account is to click on the **Sign in** button on the top-right corner of +your Netdata dashboard. + +That button will open a new tab in for Netdata Cloud, and will prompt you to log-in using email or authentication via +Google or GitHub. + +If you chose email, Netdata Cloud will send you a "magic link" via email. Once you click on the link, that node will be +connected to your Netdata Cloud account and you'll be redirected back to your dashboard. If you chose Google or GitHub, +you'll be redirected back to your dashboard as soon as authentication is finished. + +Here's what authentication via Google looks like: + + + +Depending on your authentication method, your email address or name will appear in the top right of your dashboard +instead of the **Sign in** button. + +At this point, you've successfully added a single Netdata agent to your Netdata Cloud account. _What about the rest?_ + +Well, all you have to do is visit another node and repeat the sign-in process. + +Let's use a demo system as an example. + +Visit the [Netdata website](https://www.netdata.cloud/#live-demo) and click on any of the gauge charts displayed +underneath the **Live Demo** header. + +Once the dashboard loads, repeat the Netdata Cloud sign-in process. The demo server is now associated with your Netdata +Cloud account, and will appear in your **My nodes** menu. + +Here's how the process looks in action: + +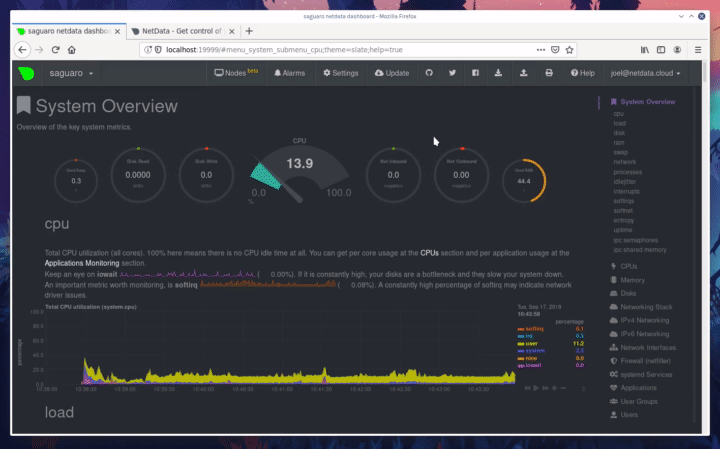 + +## Navigate between your nodes via the My nodes menu + +Once you have multiple nodes added to Netdata Cloud, they will populate your **My nodes** menu. You can use this menu to +navigate between your systems quickly. + +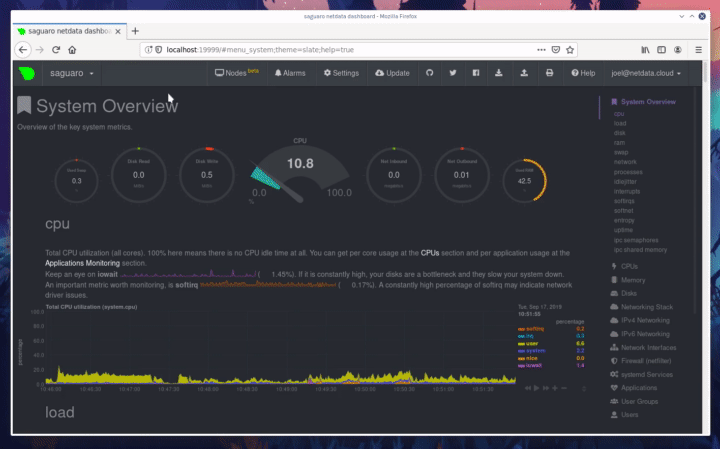 + +Whenever you pan, zoom, highlight, select, or pause a chart, Netdata will synchronize those settings with any other +agent you visit via the My nodes menu. Even your scroll position is synchronized, so you'll see the same charts and +respective data for easy comparisons or root cause analysis. + +You can now seamlessly track performance anomalies across your entire infrastructure! + +## Try out the Nodes View + +Next, let's try out the Nodes View. + +Nodes View is a feature built in to Netdata Cloud that offers a different interface for viewing the health status of +multiple nodes. + +> Learn more about all the features within Nodes View and what charts/metrics are represented there in our +> [documentation](../netdata-cloud/nodes-view.md). + +You can visit Nodes View by navigating to `https://netdata.cloud/console` in your browser. Or, you can click on the +**Nodes View** button in any Netdata dashboard. If you're not logged in to Netdata Cloud yet, you'll be asked to log in +first. + +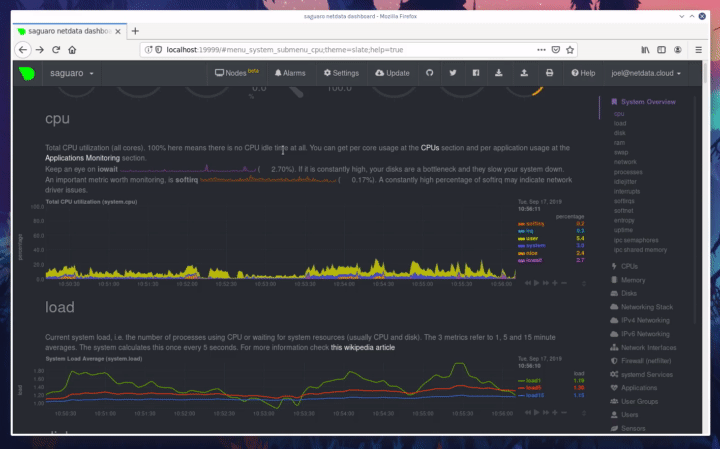 + +The Nodes View shows an aggregated list of the nodes you connected to Netdata Cloud, and shows at-a-glance health status +for each. + +Click on any of the boxes representing your nodes to see real-time, per-second charts of essential metrics in the **Node +overview** sidebar. + +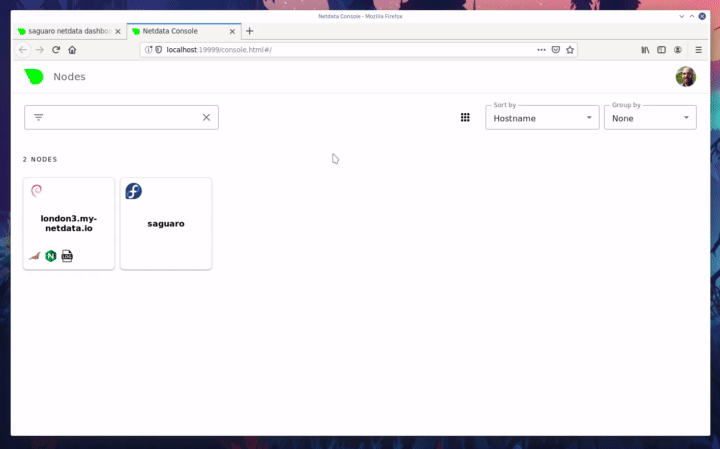 + +You can also view raised alarms and see real-time metrics from a [select number of +services/applications](../netdata-cloud/nodes-view.md#services-available-in-the-nodes-view) using the various tabs +available in the node overview sidebar. + +If you add a large number of nodes to the Nodes View, you may want to look into the different view and sorting options. +You can choose between **full**, **compact**, and **detailed** view modes. + + + +You can also sort between grouping nodes by hostname, recently viewed, or most frequestly visited. Or, group them by +alarm status, their services, or whether they're online or unreachable. + + + +Play around until you find the right settings for you and your infrastructure. + +### Remove a node from Nodes View + +If you want to clean up your Nodes View a bit, you can remove them from your Netdata Cloud account. + +Click on the node in question, and then scroll to the bottom of the Node overiew sidebar. You'll see a URL under the +**Node URLs** heading. Hover over the URL and click on the garbage bin icon. Click **Confirm** on the modal window. +Then, click the **Forget** button that appears in the sidebar, and hit **Confirm** once again. + + + +## What's next? + +Now that you know how to add multiple nodes to your Netdata |