
diff options
| author | Joel Hans <joel@netdata.cloud> | 2020-10-21 05:45:15 -0700 |
|---|---|---|
| committer | GitHub <noreply@github.com> | 2020-10-21 08:45:15 -0400 |
| commit | d0634981533990aa6f4aec2368bb54ef081946be (patch) | |
| tree | 1395f4dc1f0bae518ae589b33b0dea1fe9072c51 /docs/quickstart | |
| parent | ab0ffcebf802803d1e88f6a5e47a314c292b45e3 (diff) | |
Add documentation for Cloud Overview (#10082)
* First pass on Overview revisions
* Finish up draft of infra doc with Overview
* Rename UI element
* Tweak to Graphite doc
* Copyedit pass
* Fixes for Amy
Diffstat (limited to 'docs/quickstart')
| -rw-r--r-- | docs/quickstart/infrastructure.md | 62 |
1 files changed, 36 insertions, 26 deletions
diff --git a/docs/quickstart/infrastructure.md b/docs/quickstart/infrastructure.md index 10cf58df6c..db1756483f 100644 --- a/docs/quickstart/infrastructure.md +++ b/docs/quickstart/infrastructure.md @@ -27,41 +27,49 @@ nodes and get helpful pointers about collecting all the metrics from every criti > those nodes to your Space in Netdata Cloud. If you haven't yet, see the [_Get Netdata_ doc](/docs/get/README.md) for > details on installation and claiming. -## See your infrastructure's metrics +> If you want to monitor a Kubernetes cluster with Netdata, see our [k8s installation +> doc](/packaging/installer/methods/kubernetes.md) for setup details, and then read our guide, [_Monitor a Kubernetes +> cluster with Netdata_](/docs/guides/monitor/kubernetes-k8s-netdata.md). + +## See an overview of your infrastructure To see all your nodes from a single pane of glass, first [sign in](https://app.netdata.cloud) to Netdata Cloud. As you -sign in, Netdata Cloud pings each claimed node to start on-demand streaming from your nodes to your browser. When -Netdata Cloud loads your War Room's **Nodes** view, you'll immediately see key metrics from your nodes, streamed in -real time, in a single interface. +navigate to a particular War Room, Netdata Cloud pings each claimed node to start on-demand streaming from your nodes to +your browser. - +Netdata Cloud then visualizes all these metrics, from any number of distributed nodes, in the War Room's **Overview**. +The Overview features composite charts, which display aggregated metrics from multiple nodes. -You can drill down into any node's full dashboard by clicking on that node's hostname in the Nodes view. +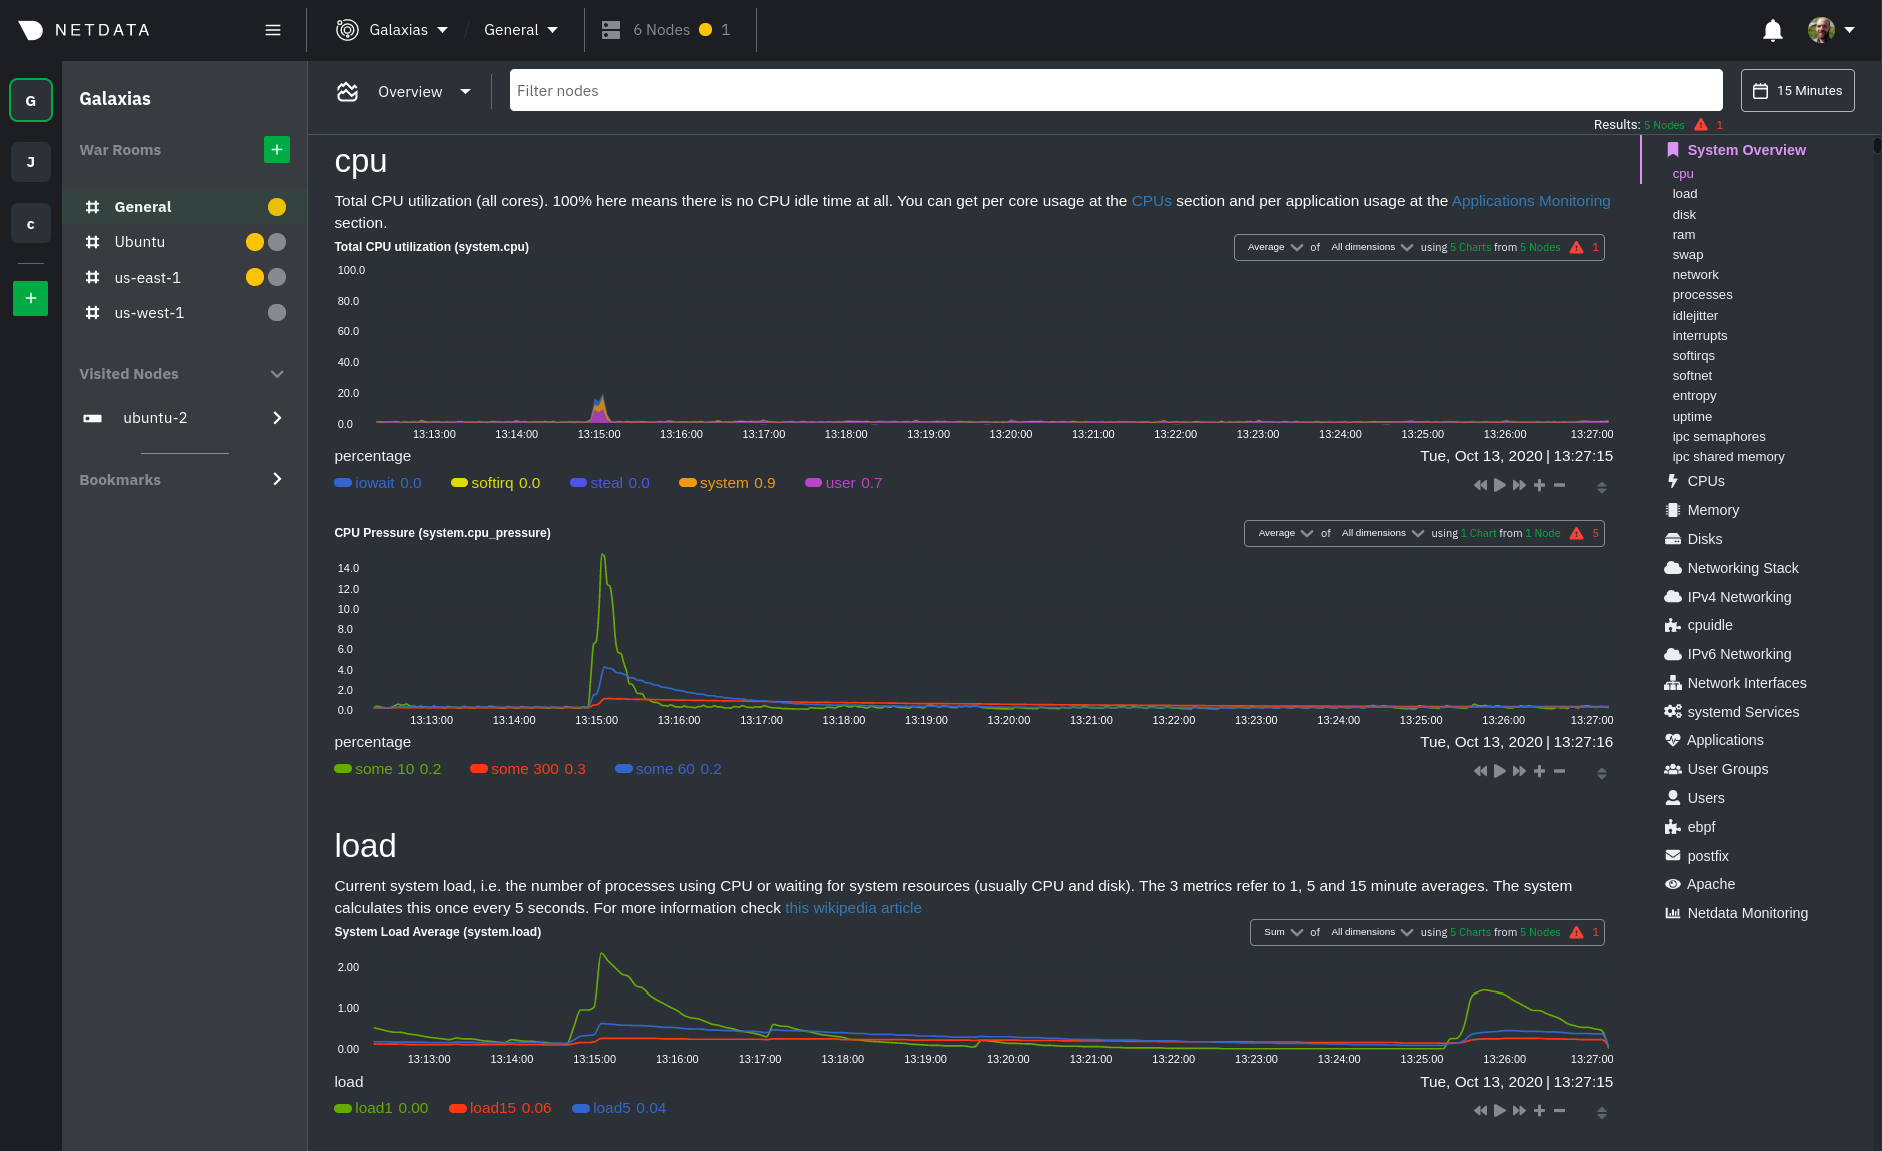 -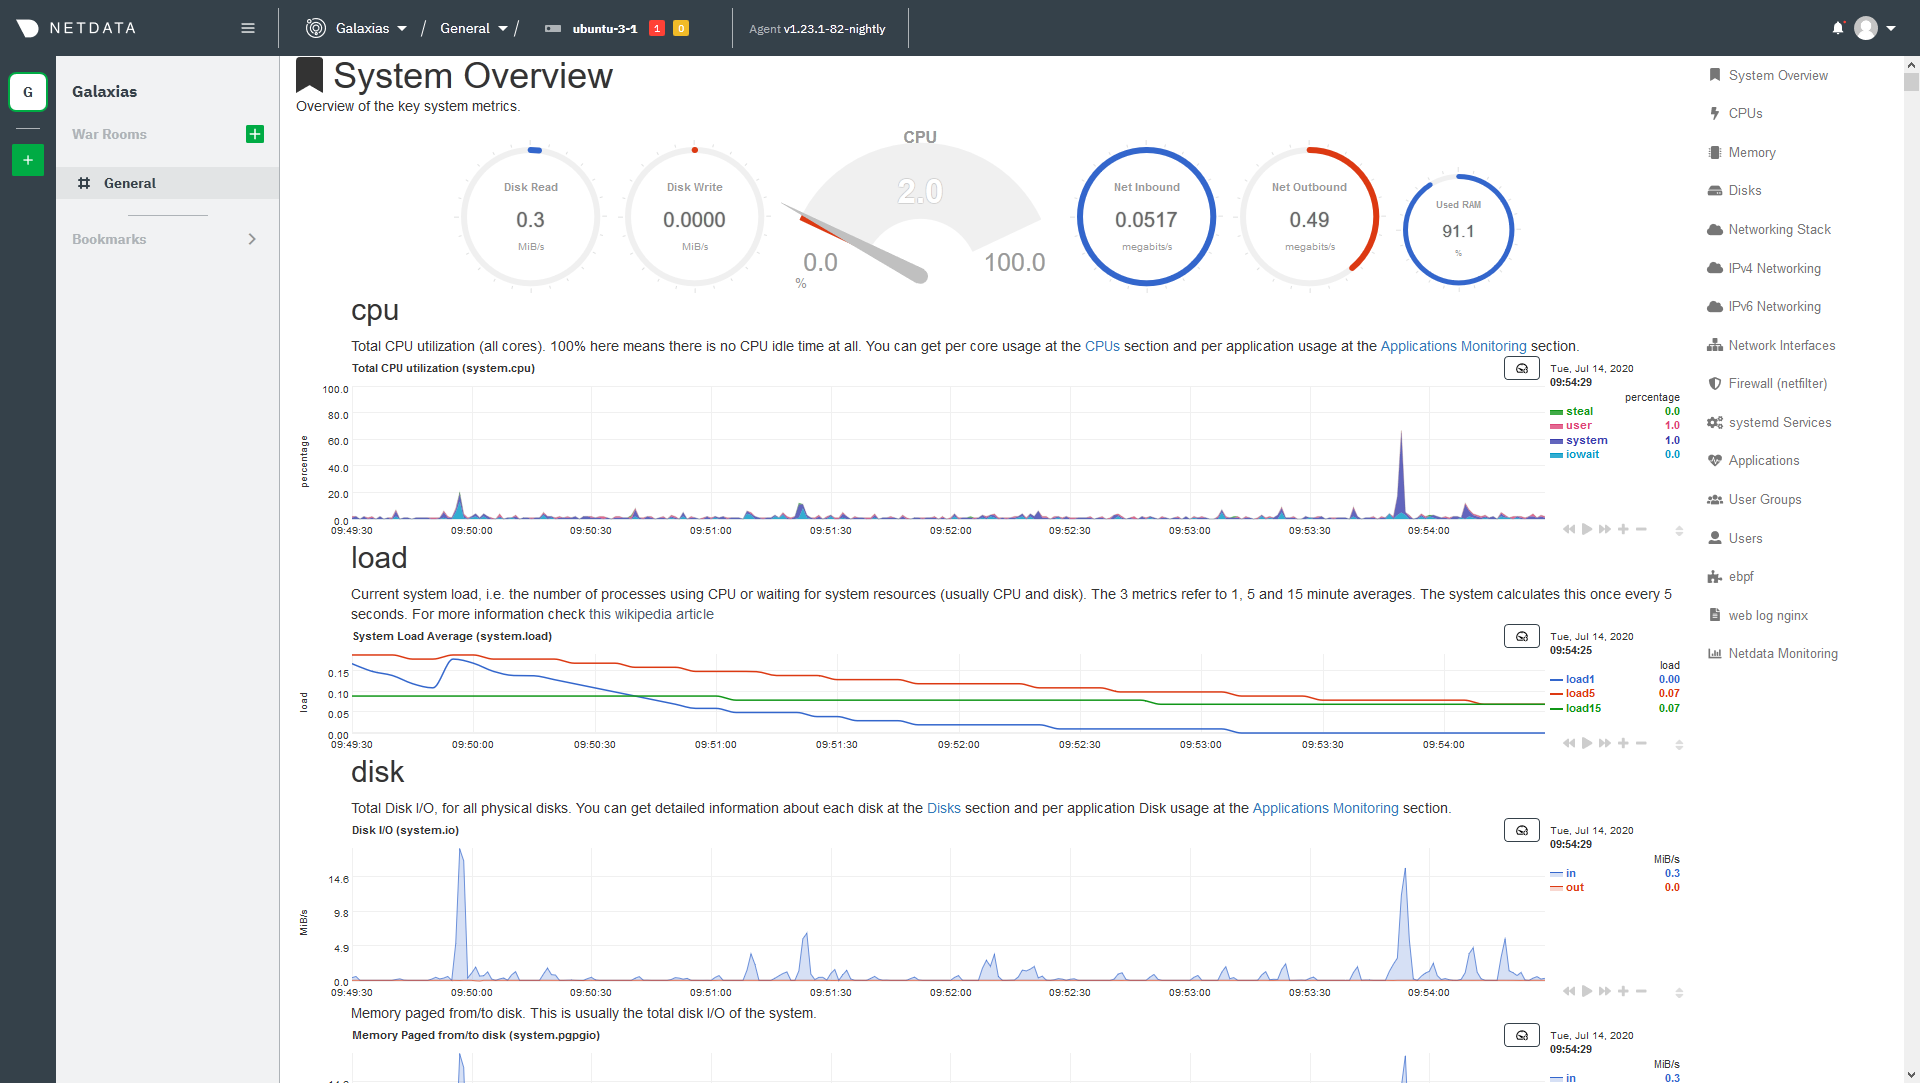 +Netdata Cloud also features the **Nodes view**, which you can use to configure and see a few key metrics from every node +in the War Room, view health status, and more. -You can use single-node dashboards in Netdata Cloud to drill down on specific issues, scrub backward in time to -investigate historical data, and see like metrics presented meaningfully to help you troubleshoot performance problems. -Learn about [interacting with dashboards and charts](/docs/visualize/interact-dashboards-charts.md) to get the most from -all of Netdata's real-time metrics. +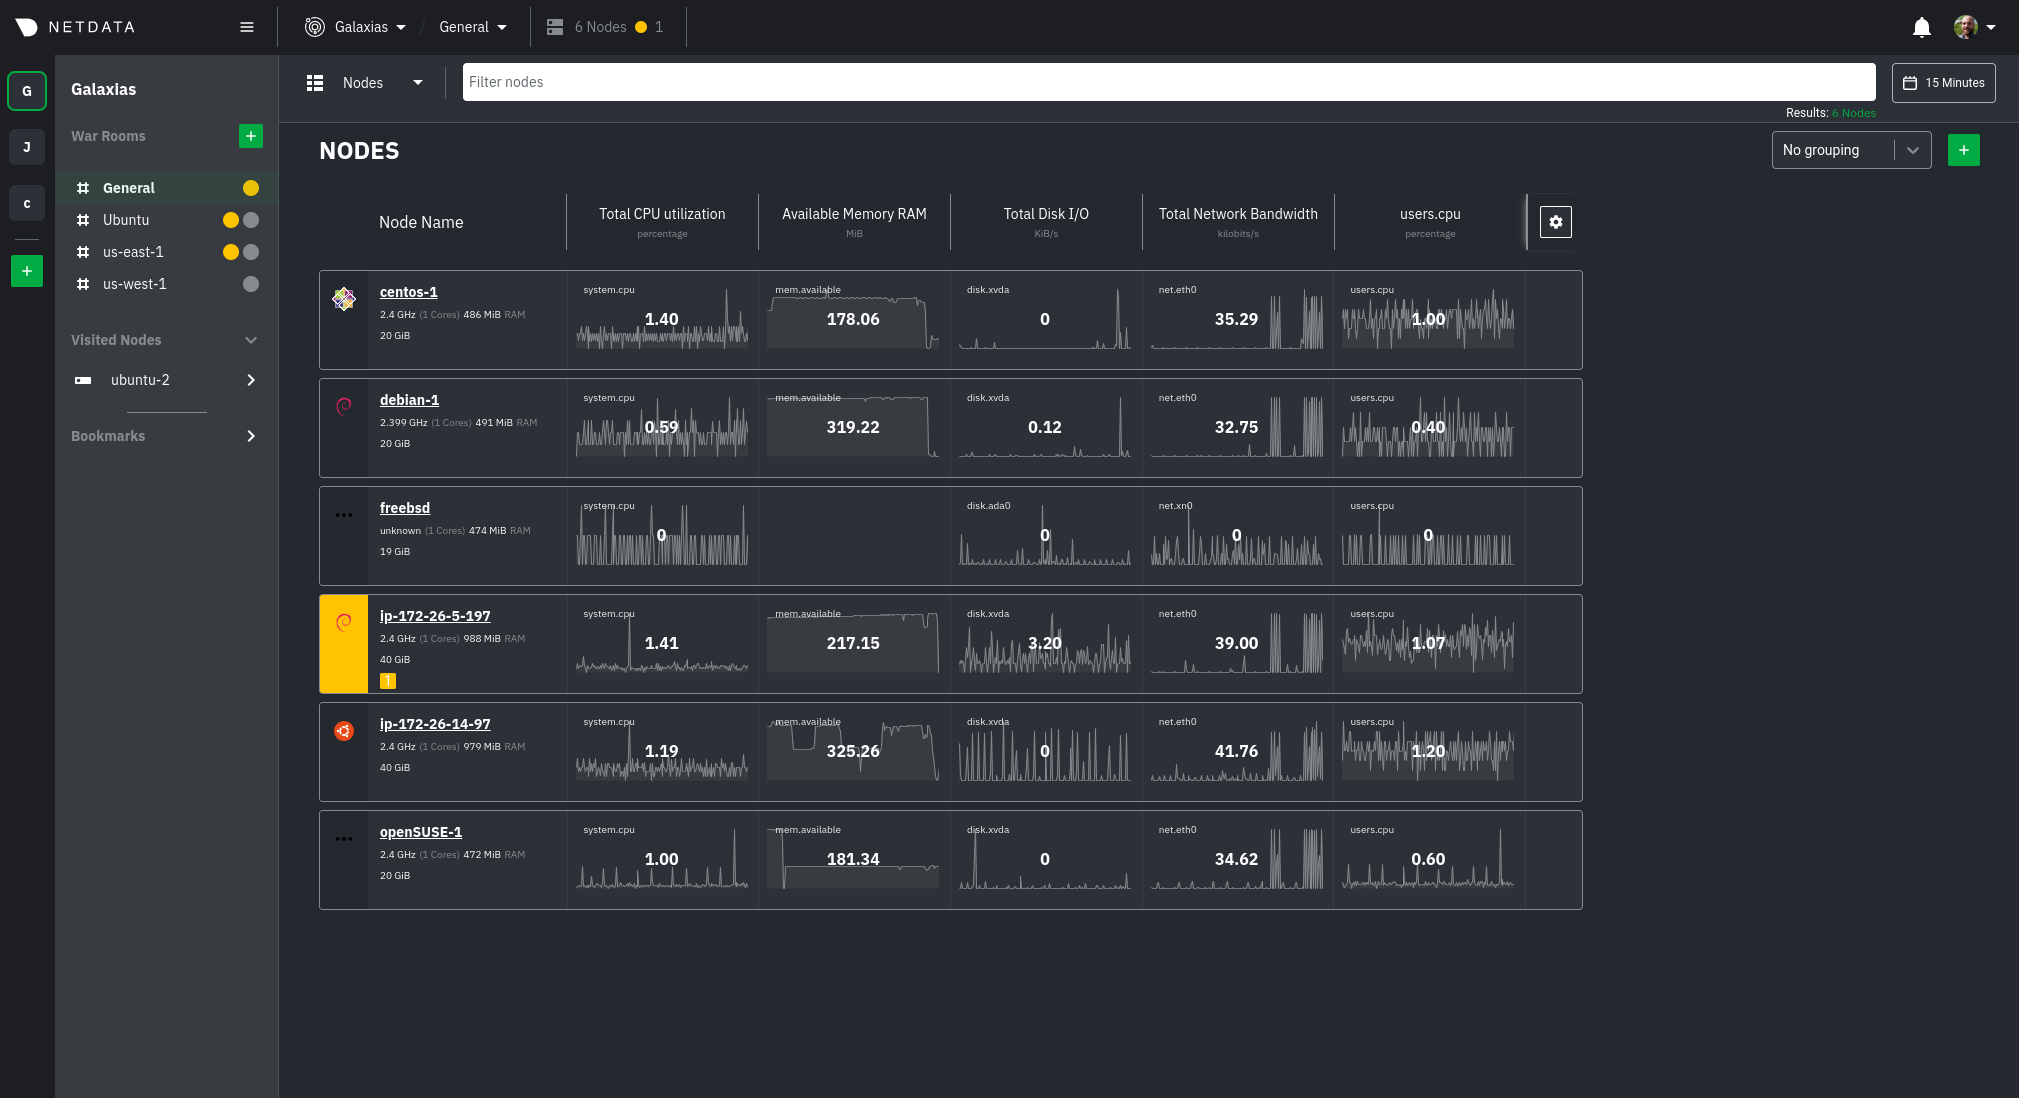 -> If you want to monitor a Kubernetes cluster with Netdata, see our [k8s installation -> doc](/packaging/installer/methods/kubernetes.md) for setup details, and then read our guide, [_Monitor a Kubernetes -> cluster with Netdata_](/docs/guides/monitor/kubernetes-k8s-netdata.md). +Read more about both features in the [infrastructure overview](/docs/visualize/overview-infrastructure.md) doc. -## Build new dashboards for your infrastructure +## Drill down to specific nodes -You can use Netdata Cloud to build new dashboards that match your infrastructure's topology or help you diagnose complex -issues by aggregating correlated charts from any number of nodes. +Both the Overview and Nodes view offer easy access to **single-node dashboards** for targeted analysis. You can use +single-node dashboards in Netdata Cloud to drill down on specific issues, scrub backward in time to investigate +historical data, and see like metrics presented meaningfully to help you troubleshoot performance problems. -To build your first dashboard, click on the **Nodes** dropdown, then select **+ Add**. Enter a name to assign to this -dashboard. Click on either of the **Add chart** buttons, then select the node you want to add a chart from. Select the -context, which is Netdata's way to organize charts, and then click **Add chart**. +Read about the process in the [infrastructure +overview](/docs/visualize/overview-infrastructure.md#single-node-dashboards) doc, then learn about [interacting with +dashboards and charts](/docs/visualize/interact-dashboards-charts.md) to get the most from all of Netdata's real-time +metrics. -Once you add a few charts, you can move them around, resize them, and add text. Make sure you click the **Save** button -before you navigate away. +## Create new dashboards + +You can use Netdata Cloud to create new dashboards that match your infrastructure's topology or help you diagnose +complex issues by aggregating correlated charts from any number of nodes. For example, you could monitor the system CPU +from every node in your infrastructure on a single dashboard. + +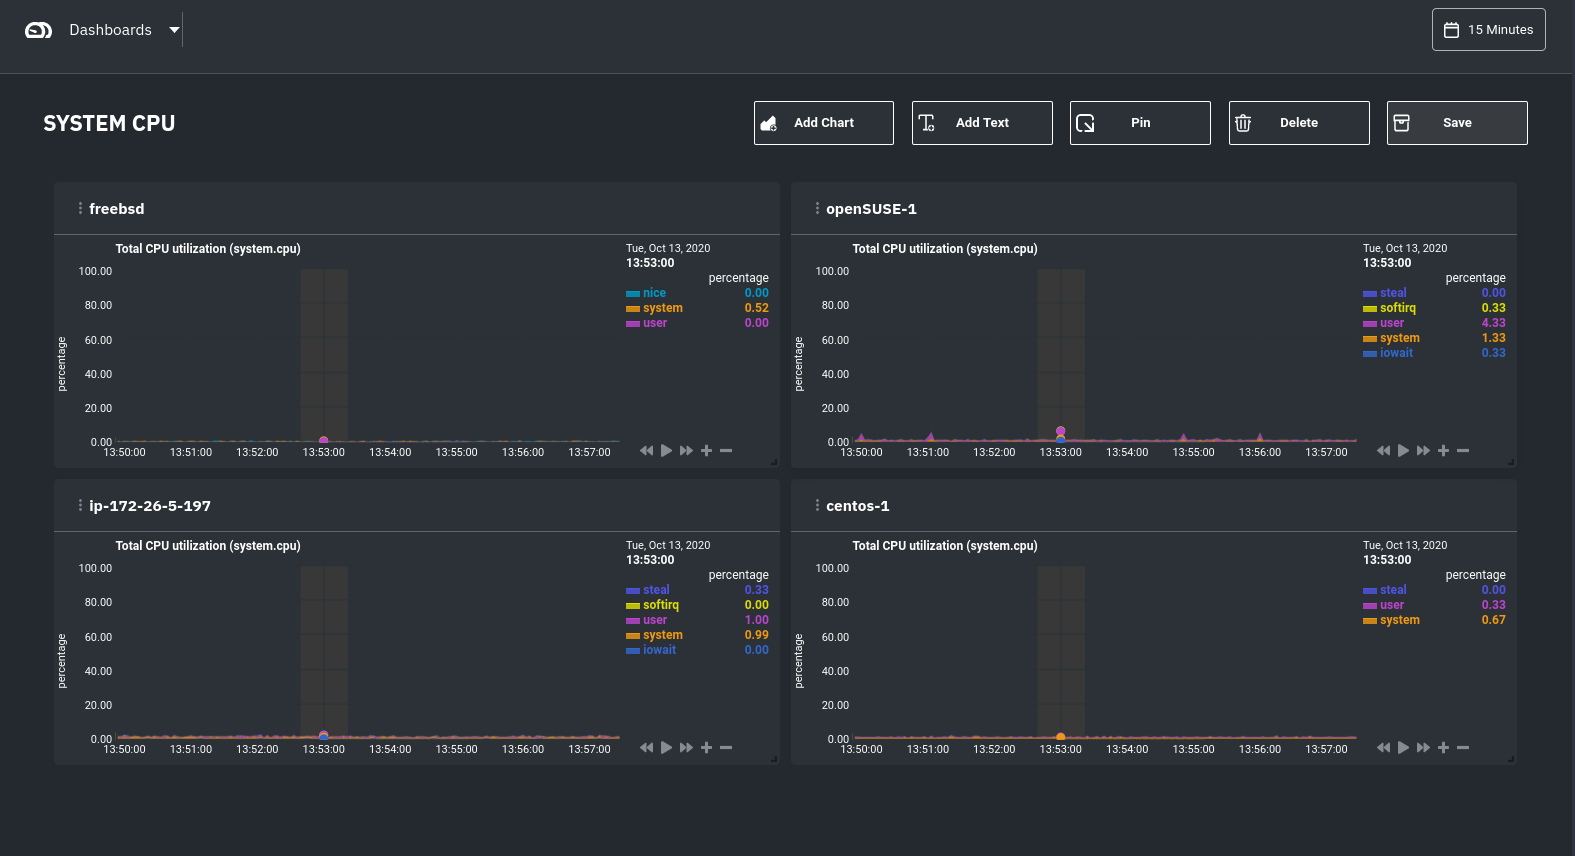 +) Read more about [creating new dashboards](/docs/visualize/create-dashboards.md) for more details about the process and additional tips on best leveraging the feature to help you troubleshoot complex performance problems. @@ -114,10 +122,10 @@ Once you have a handle on configuration and are collecting all the right metrics infrastructure-focused features: - [Organize your nodes](/docs/configure/spaces-war-rooms.md) into **War Rooms** based on your preferred strategy. +- [See an overview of your infrastructure](/docs/visualize/overview-infrastructure.md) using Netdata Cloud's various + preconfigured dashboards. - [Invite your team](/docs/configure/invite-collaborate.md) to collaborate on identifying anomalies or troubleshooting complex performance problems. -- [Export metrics](/docs/export/external-databases.md) to an external time-series database to use Netdata alongside - other monitoring and troubleshooting tools. To change how the Netdata Agent runs on each node, dig in to configuration files: @@ -127,5 +135,7 @@ To change how the Netdata Agent runs on each node, dig in to configuration files - [Create new alarms](/docs/monitor/configure-alarms.md), or tweak some of the pre-configured alarms, to stay on top of anomalies. - [Enable notifications](/docs/monitor/enable-notifications.md) to Slack, PagerDuty, email, and 30+ other services. +- [Export metrics](/docs/export/external-databases.md) to an external time-series database to use Netdata alongside + other monitoring and troubleshooting tools. [](<>) |