
diff options
| author | Joel Hans <joel@netdata.cloud> | 2020-12-07 14:48:52 -0700 |
|---|---|---|
| committer | GitHub <noreply@github.com> | 2020-12-07 14:48:52 -0700 |
| commit | a80af1b120af6504c1b42f4c80882c5efc461a8d (patch) | |
| tree | 88cff6f61c0e28a50e11e967c344298bfb10b713 /docs/quickstart | |
| parent | 6d91cedecd5ee3f58e5fe8af48ea5eac33abb967 (diff) | |
Improve core documentation to align with recent Netdata Cloud releases (#10318)
* Change overview doc with group by node
* Add hash to link
* Update core documentation with latest from Cloud
* Fix link
* Fixes for Amy
* Fixes for Odysseas
Diffstat (limited to 'docs/quickstart')
| -rw-r--r-- | docs/quickstart/infrastructure.md | 117 |
1 files changed, 80 insertions, 37 deletions
diff --git a/docs/quickstart/infrastructure.md b/docs/quickstart/infrastructure.md index db1756483f..aa89d7a533 100644 --- a/docs/quickstart/infrastructure.md +++ b/docs/quickstart/infrastructure.md @@ -7,50 +7,83 @@ custom_edit_url: https://github.com/netdata/netdata/edit/master/docs/quickstart/ # Infrastructure monitoring with Netdata -Together, the Netdata Agent and Netdata Cloud create a powerful, infinitely-scalable infrastructure monitoring solution. +[Netdata Cloud](https://app.netdata.cloud) provides scalable infrastructure monitoring for any number of distributed +nodes running the Netdata Agent. A node is any system in your infrastructure that you want to monitor, whether it's a +physical or virtual machine (VM), container, cloud deployment, or edge/IoT device. The Netdata Agent uses zero-configuration collectors to gather metrics from every application and container instantly, and uses Netdata's [distributed data architecture](/docs/store/distributed-data-architecture.md) to store metrics locally. Without a slow and troublesome centralized data lake for your infrastructure's metrics, you reduce the resources you need to invest in, and the complexity of, monitoring your infrastructure. -Netdata Cloud unifies monitoring your infrastructure by _centralizing the interface_ you use to query and visualize your +Netdata Cloud unifies infrastructure monitoring by _centralizing the interface_ you use to query and visualize your nodes' metrics, not the data. By streaming metrics values to your browser, with Netdata Cloud acting as the secure proxy between them, you can monitor your infrastructure using customizable, interactive, and real-time visualizations from any numbe of distributed nodes. -In this quickstart guide, you'll learn how to see key metrics from all your nodes in one interface and build your first -dashboard for aggregating like metrics from many distributed nodes. You'll then take a peek into configuring individual -nodes and get helpful pointers about collecting all the metrics from every critical application in your infrastructure. +In this quickstart guide, you'll learn the basics of using Netdata Cloud to monitor an infrastructure with dashboards, +composite charts, and alarm viewing. You'll then learn about the most critical ways to configure the Agent on each of +your nodes to maximize the value you get from Netdata. -> This quickstart assumes you've installed the Netdata Agent on more than one node in your infrastructure, and claimed -> those nodes to your Space in Netdata Cloud. If you haven't yet, see the [_Get Netdata_ doc](/docs/get/README.md) for -> details on installation and claiming. +This quickstart assumes you've installed the Netdata Agent on more than one node in your infrastructure, and claimed +those nodes to your Space in Netdata Cloud. If you haven't yet, see the [_Get Netdata_ doc](/docs/get/README.md) for +details on signing up for Netdata Cloud, installation, and claiming. > If you want to monitor a Kubernetes cluster with Netdata, see our [k8s installation > doc](/packaging/installer/methods/kubernetes.md) for setup details, and then read our guide, [_Monitor a Kubernetes > cluster with Netdata_](/docs/guides/monitor/kubernetes-k8s-netdata.md). -## See an overview of your infrastructure +## Set up your Netdata Cloud experience -To see all your nodes from a single pane of glass, first [sign in](https://app.netdata.cloud) to Netdata Cloud. As you -navigate to a particular War Room, Netdata Cloud pings each claimed node to start on-demand streaming from your nodes to -your browser. +Start your infrastructure monitoring experience by setting up your Netdata Cloud account. -Netdata Cloud then visualizes all these metrics, from any number of distributed nodes, in the War Room's **Overview**. -The Overview features composite charts, which display aggregated metrics from multiple nodes. +### Organize Spaces and War Rooms + +Spaces are high-level containers to help you organize your team members and the nodes they can view in each War Room. +You already have at least one Space in your Netdata Cloud account. + +A single Space puts all your metrics in one easily-accessible place, while multiple Spaces creates logical division +between different users and different pieces of a large infrastructure. For example, a large organization might have one +SRE team for the user-facing SaaS application, and a second IT team for managing employees' hardware. Since these teams +don't monitor the same nodes, they can work in separate Spaces and then further organize their nodes into War Rooms. + +Next, set up War Rooms. Netdata Cloud creates dashboards and visualizations based on the nodes added to a given War +Room. You can [organize War Rooms](https://learn.netdata.cloud/docs/cloud/war-rooms#war-room-organization) in any way +you want, such as by the application type, for end-to-end application monitoring, or as an incident response tool. + +Learn more about [Spaces](https://learn.netdata.cloud/docs/cloud/spaces) and [War +Rooms](https://learn.netdata.cloud/docs/cloud/war-rooms), including how to manage each, in their respective reference +documentation. + +### Invite your team + +Netdata Cloud makes an infrastructure's real-time metrics available and actionable to all organization members. By +inviting others, you can better synchronize with your team or colleagues to understand your infrastructure's heartbeat. +When something goes wrong, you'll be ready to collaboratively troubleshoot complex performance problems from a single +pane of glass. + +To invite new users, click on **Invite Users** in the left-hand navigation panel beneath your Space's name. Choose which +War Rooms to add this user to, then click **Send**. + +If your team members have trouble signing in, direct them to the [Netdata Cloud sign +in](https://learn.netdata.cloud/docs/cloud/manage/sign-in) doc. + +### See an overview of your infrastructure + +The default way to visualize the health and performance of an infrastructure with Netdata Cloud is the +[**Overview**](/docs/visualize/overview-infrastructure.md), which is the default interface of every War Room. The +Overview features composite charts, which display aggregated metrics from every node in a given War Room. These metrics +are streamed on-demand from individual nodes and composited onto a single, familiar dashboard. 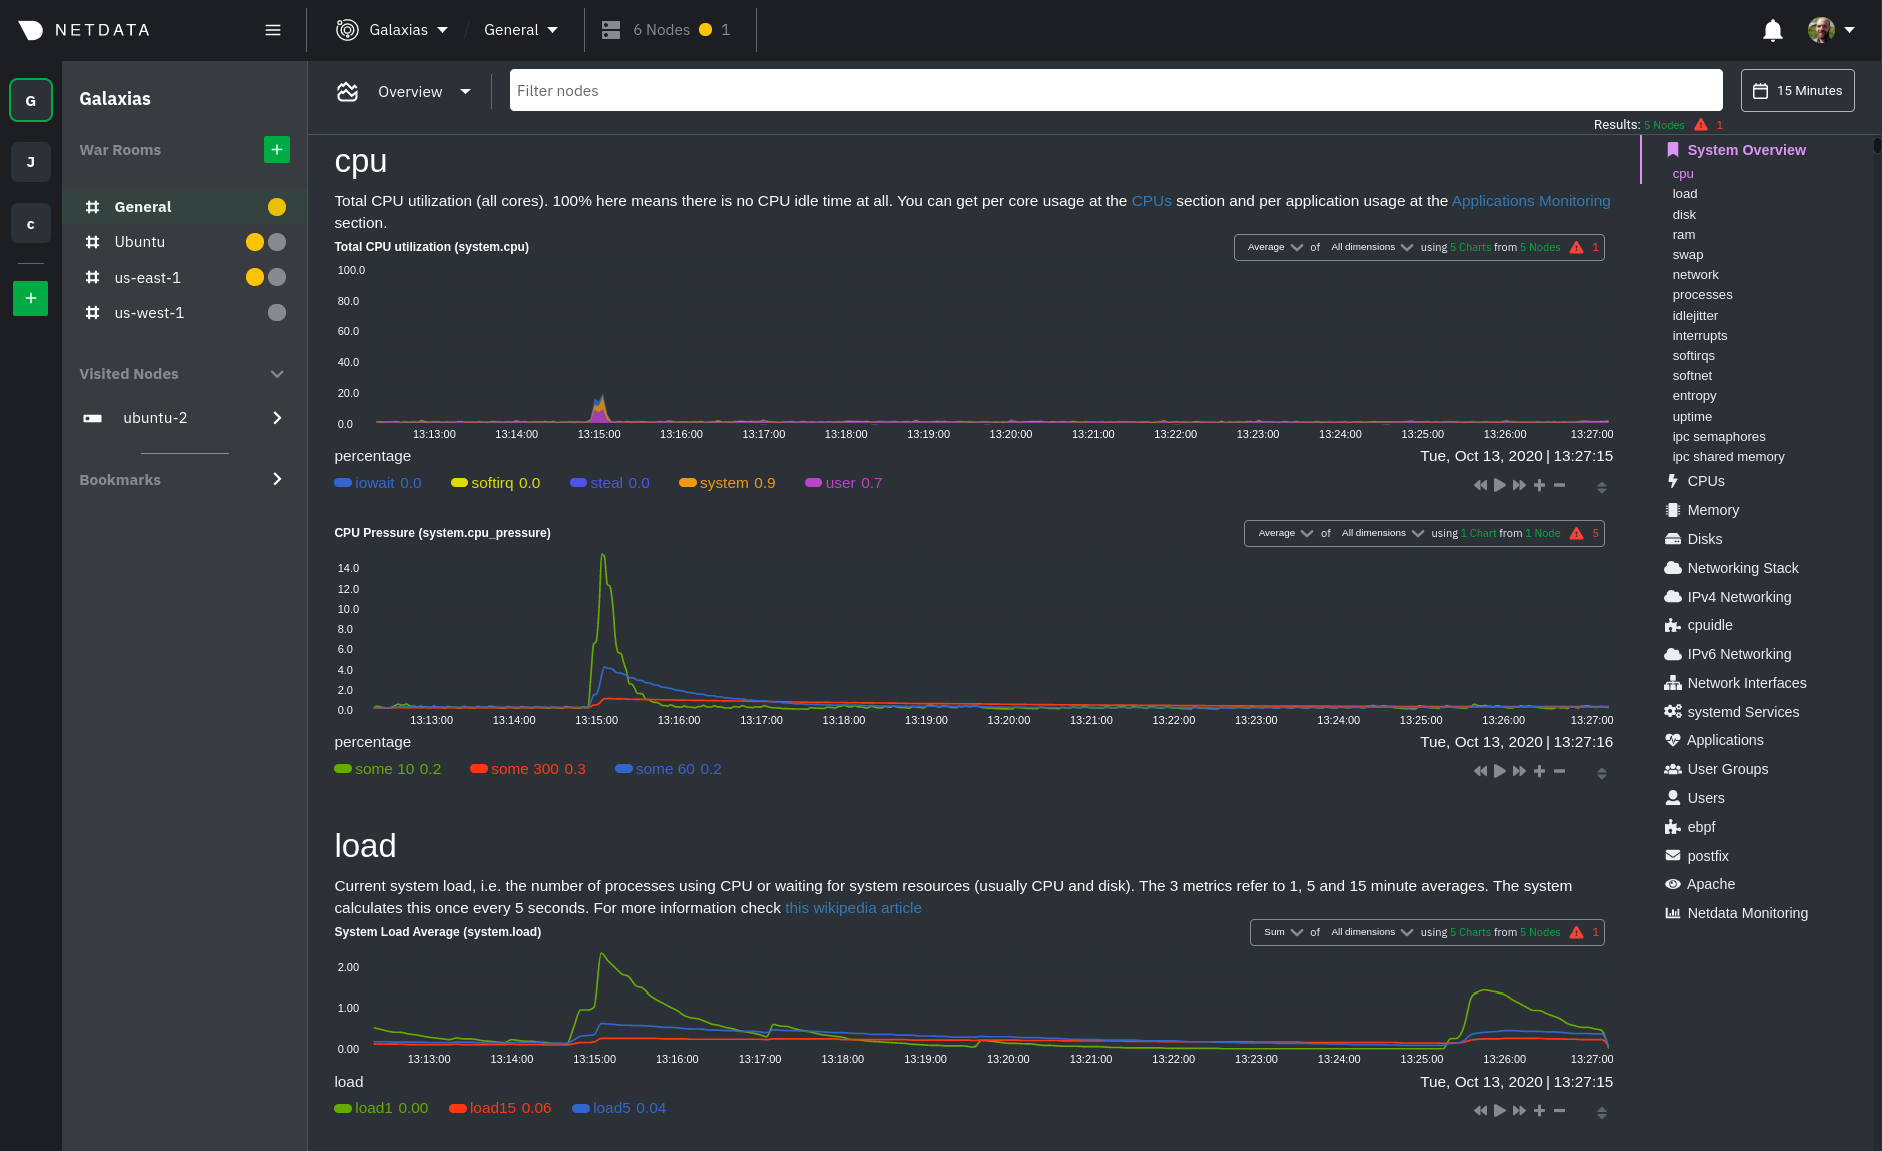 -Netdata Cloud also features the **Nodes view**, which you can use to configure and see a few key metrics from every node -in the War Room, view health status, and more. - -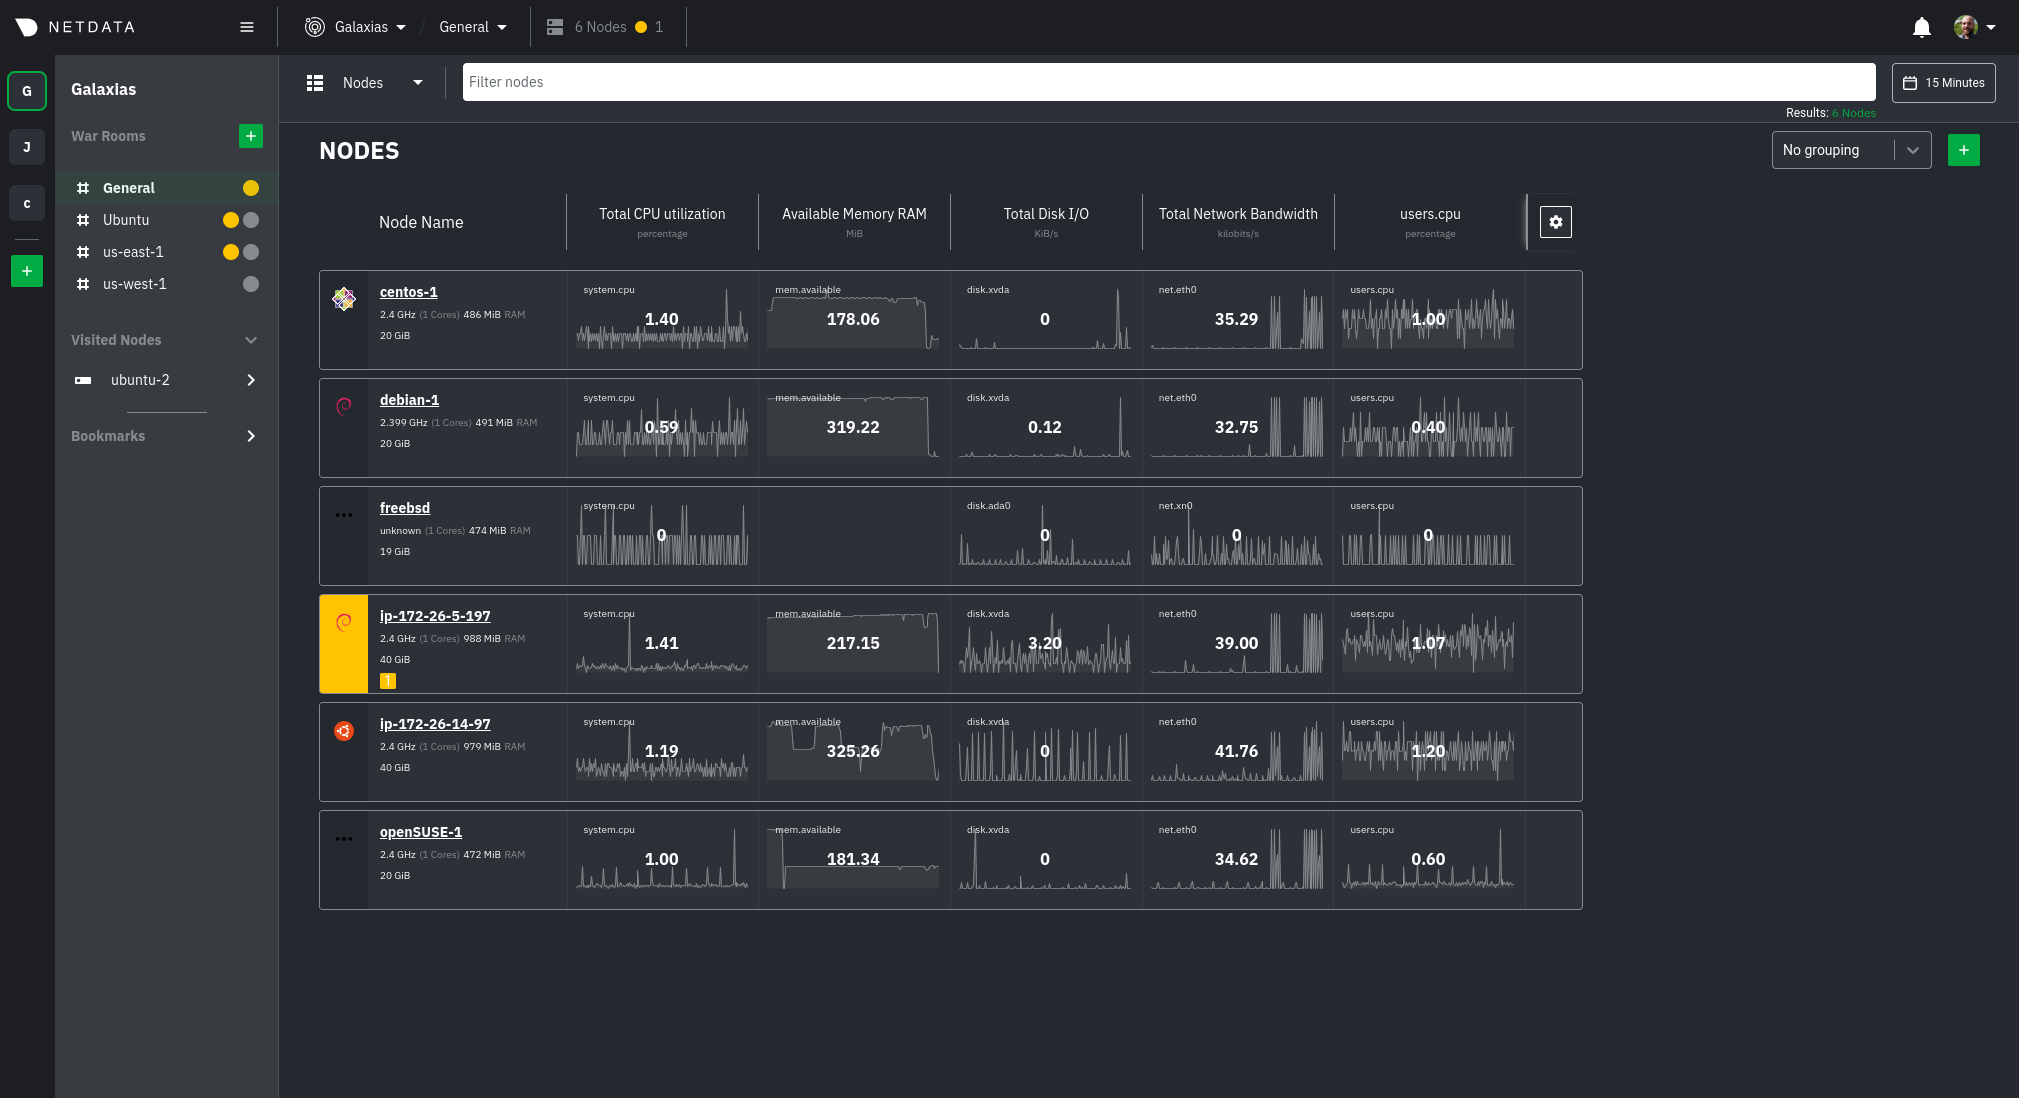 +Read more about the Overview in the [infrastructure overview](/docs/visualize/overview-infrastructure.md) doc. -Read more about both features in the [infrastructure overview](/docs/visualize/overview-infrastructure.md) doc. +Netdata Cloud also features the [**Nodes view**](https://learn.netdata.cloud/docs/cloud/visualize/nodes), which you can +use to configure and see a few key metrics from every node in the War Room, view health status, and more. -## Drill down to specific nodes +### Drill down to specific nodes Both the Overview and Nodes view offer easy access to **single-node dashboards** for targeted analysis. You can use single-node dashboards in Netdata Cloud to drill down on specific issues, scrub backward in time to investigate @@ -61,7 +94,7 @@ overview](/docs/visualize/overview-infrastructure.md#single-node-dashboards) doc dashboards and charts](/docs/visualize/interact-dashboards-charts.md) to get the most from all of Netdata's real-time metrics. -## Create new dashboards +### Create new dashboards You can use Netdata Cloud to create new dashboards that match your infrastructure's topology or help you diagnose complex issues by aggregating correlated charts from any number of nodes. For example, you could monitor the system CPU @@ -69,12 +102,21 @@ from every node in your infrastructure on a single dashboard. 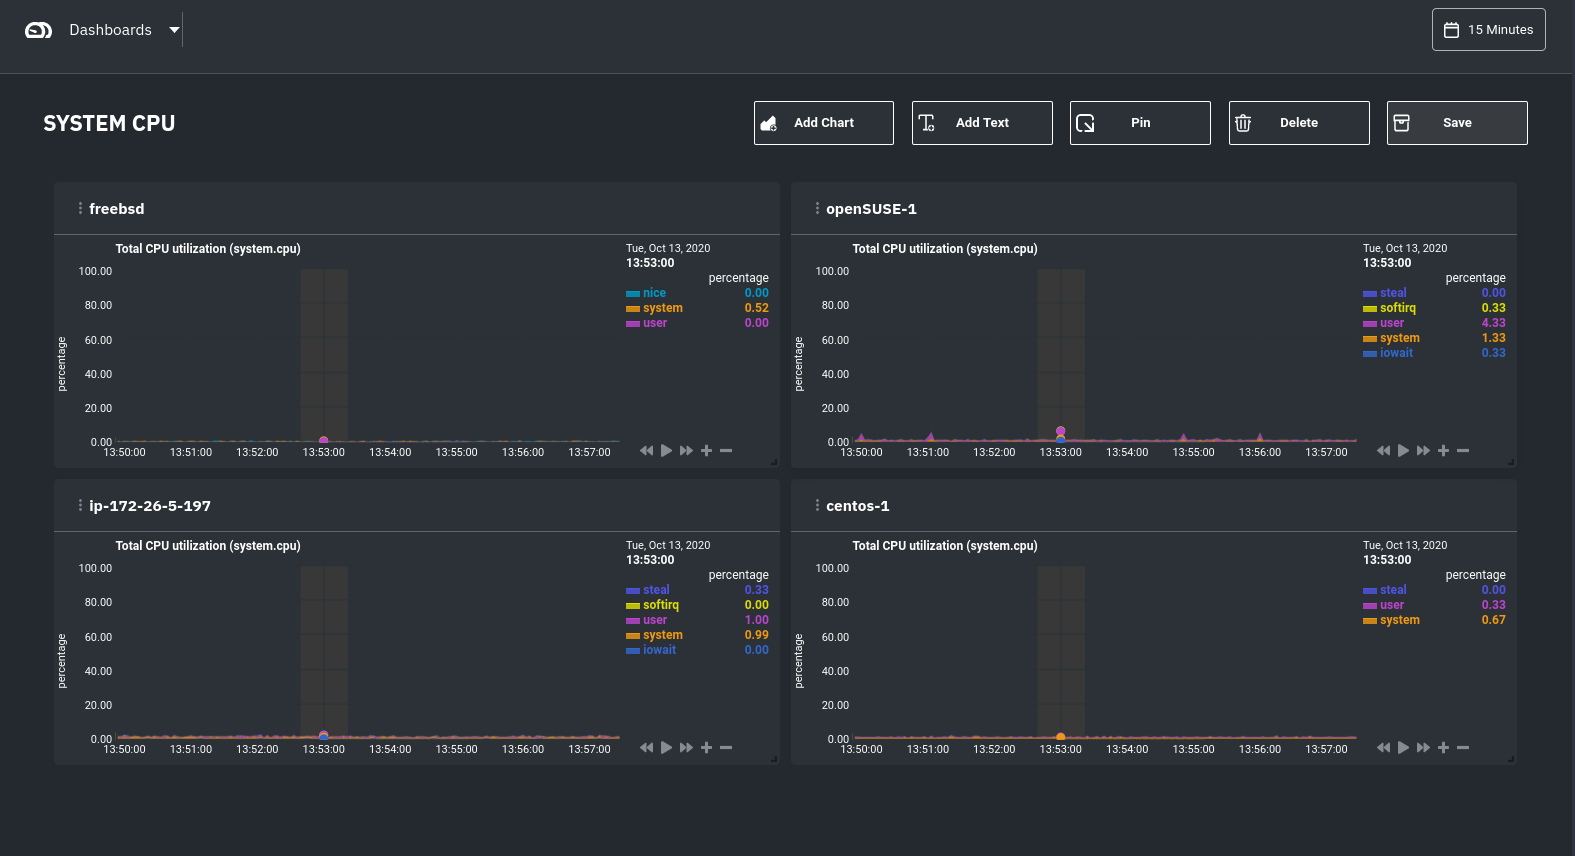 -) Read more about [creating new dashboards](/docs/visualize/create-dashboards.md) for more details about the process and additional tips on best leveraging the feature to help you troubleshoot complex performance problems. -## Configure your nodes +## Set up your nodes + +You get the most value out of Netdata Cloud's infrastructure monitoring capabilities if each node collects every +possible metric. For example, if a node in your infrastructure is responsible for serving a MySQL database, you should +ensure that the Netdata Agent on that node is properly collecting and streaming all MySQL-related metrics. + +In most cases, collectors autodetect their data source and require no configuration, but you may need to configure +certain behaviors based on your infrastructure. Or, you may want to enable/configure advanced functionality, such as +longer metrics retention or streaming. + +### Configure the Netdata Agent on your nodes You can configure any node in your infrastructure if you need to, although most users will find the default settings work extremely well for monitoring their infrastructures. @@ -95,21 +137,15 @@ After you've learned the basics, you should [secure your infrastructure's nodes] one of our recommended methods. These security best practices ensure no untrusted parties gain access to the metrics collected on any of your nodes. -## Collect metrics from your systems and applications +### Collect metrics from systems and applications Netdata has [300+ pre-installed collectors](/collectors/COLLECTORS.md) that gather thousands of metrics with zero configuration. Collectors search each of your nodes in default locations and ports to find running applications and gather as many metrics as they can without you having to configure them individually. -In fact, Netdata is already collecting thousands of metrics per second from your webservers, databases, containers, and -much more, on each node in your infrastructure. - -These metrics enrich your Netdata Cloud experience. You can see metrics from systems, containers, and applications in -the individual node dashboards, and you can create new dashboards around very specific charts, such as the real-time -volume of 503 responses from each of your webserver nodes. - Most collectors work without configuration, but you should read up on [how collectors -work](/docs/collect/how-collectors-work.md) and [how to enable/configure](/docs/collect/enable-configure.md) them. +work](/docs/collect/how-collectors-work.md) and [how to enable/configure](/docs/collect/enable-configure.md) them so +that you can see metrics from those applications in Netdata Cloud. In addition, find detailed information about which [system](/docs/collect/system-metrics.md), [container](/docs/collect/container-metrics.md), and [application](/docs/collect/application-metrics.md) metrics you can @@ -121,11 +157,9 @@ Netdata has many features that help you monitor the health of your nodes and tro Once you have a handle on configuration and are collecting all the right metrics, try out some of Netdata's other infrastructure-focused features: -- [Organize your nodes](/docs/configure/spaces-war-rooms.md) into **War Rooms** based on your preferred strategy. -- [See an overview of your infrastructure](/docs/visualize/overview-infrastructure.md) using Netdata Cloud's various - preconfigured dashboards. -- [Invite your team](/docs/configure/invite-collaborate.md) to collaborate on identifying anomalies or troubleshooting - complex performance problems. +- [See an overview of your infrastructure](/docs/visualize/overview-infrastructure.md) using Netdata Cloud's composite + charts and real-time visualizations. +- [Create new dashboards](/docs/visualize/create-dashboards.md) from any number of nodes and metrics in Netdata Cloud. To change how the Netdata Agent runs on each node, dig in to configuration files: @@ -138,4 +172,13 @@ To change how the Netdata Agent runs on each node, dig in to configuration files - [Export metrics](/docs/export/external-databases.md) to an external time-series database to use Netdata alongside other monitoring and troubleshooting tools. +### Related reference documentation + +- [Netdata Cloud · Spaces](https://learn.netdata.cloud/docs/cloud/spaces) +- [Netdata Cloud · War Rooms](https://learn.netdata.cloud/docs/cloud/war-rooms) +- [Netdata Cloud · Invite your team](https://learn.netdata.cloud/docs/cloud/manage/invite-your-team) +- [Netdata Cloud · Sign in or sign up with email, Google, or + GitHub](https://learn.netdata.cloud/docs/cloud/manage/sign-in) +- [Netdata Cloud · Nodes view](https://learn.netdata.cloud/docs/cloud/visualize/nodes) + [](<>) |