
diff options
| author | Joel Hans <joel@netdata.cloud> | 2020-10-01 07:49:39 -0700 |
|---|---|---|
| committer | GitHub <noreply@github.com> | 2020-10-01 07:49:39 -0700 |
| commit | 82ccdfd45eccf420ab11f4ffbdaf4eb3565c9f31 (patch) | |
| tree | dca0121966c21927ecc25be3f8b92be810c416ca /docs/monitor | |
| parent | b9bc990af36ce8917fc037f681d0b1987b78eb81 (diff) | |
Clean up and better cross-link new docsv2 documents (#10015)
* Finish cleanup pass
* Fixes for Amy
Diffstat (limited to 'docs/monitor')
| -rw-r--r-- | docs/monitor/configure-alarms.md | 8 | ||||
| -rw-r--r-- | docs/monitor/view-active-alarms.md | 16 |
2 files changed, 11 insertions, 13 deletions
diff --git a/docs/monitor/configure-alarms.md b/docs/monitor/configure-alarms.md index a11ba32a27..4575b03ea1 100644 --- a/docs/monitor/configure-alarms.md +++ b/docs/monitor/configure-alarms.md @@ -60,10 +60,8 @@ Save the file and [reload Netdata's health configuration](#reload-health-configu ### Silence an individual alarm -Many Netdata users don't need all the default alarms enabled. Instead of disabling any given alarm, or even _all_ -alarms, you can silence individual alarms by changing one line in a given health entity. - -To silence any single alarm, change the `to:` line to `silent`. +Instead of disabling an alarm altogether, or even disabling _all_ alarms, you can silence individual alarms by changing +one line in a given health entity. To silence any single alarm, change the `to:` line in its entity to `silent`. ```yaml to: silent @@ -72,7 +70,7 @@ To silence any single alarm, change the `to:` line to `silent`. ## Write a new health entity While tuning existing alarms may work in some cases, you may need to write entirely new health entities based on how -your systems and applications work. +your systems, containers, and applications work. Read Netdata's [health reference](/health/REFERENCE.md#health-entity-reference) for a full listing of the format, syntax, and functionality of health entities. diff --git a/docs/monitor/view-active-alarms.md b/docs/monitor/view-active-alarms.md index 81460095fe..f624af91cb 100644 --- a/docs/monitor/view-active-alarms.md +++ b/docs/monitor/view-active-alarms.md @@ -16,25 +16,25 @@ active alarms in both the local dashboard and Netdata Cloud. You can see active alarms from any node in your infrastructure in two ways: Click on the bell 🔔 icon in the top navigation, or click on the first column of any node's row in Nodes. This column's color changes based on the node's -health status: gray is `CLEAR`, yellow is `WARNING`, and red is `CRITICAL`. +[health status](/health/REFERENCE.md#alarm-statuses): gray is `CLEAR`, yellow is `WARNING`, and red is `CRITICAL`. -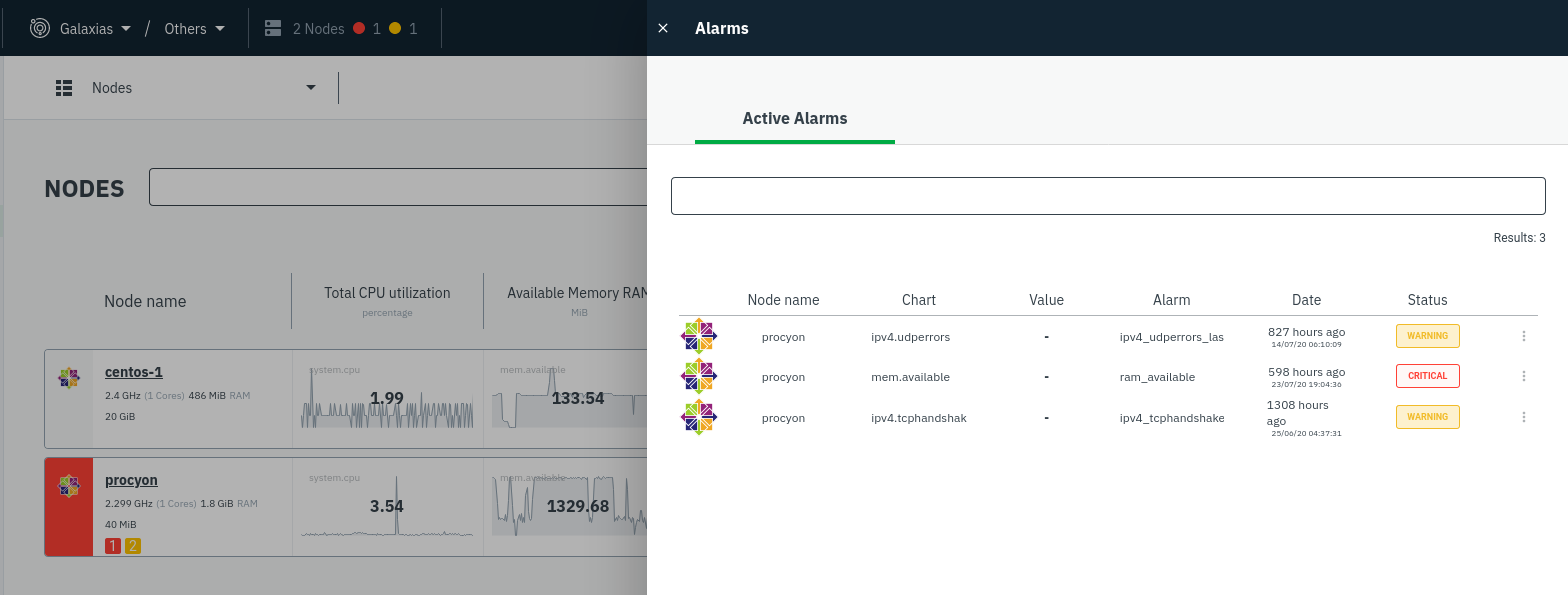 + The Alarms panel lists all active alarms for nodes within that War Room, and tells you which chart triggered the alarm, what that chart's current value is, the alarm that triggered it, and when the alarm status first began. -You can use the input field in the Alarms panel to filter active alarms. You can sort by the node's name, alarm, status, -chart that triggered the alarm, or the operating system. Read more about the [filtering +Use the input field in the Alarms panel to filter active alarms. You can sort by the node's name, alarm, status, chart +that triggered the alarm, or the operating system. Read more about the [filtering syntax](/docs/visualize/view-all-nodes.md#filter-and-group-your-infrastructure) to build valuable filters for your infrastructure. Click on the 3-dot icon (`⋮`) to view active alarm information or navigate directly to the offending chart in that node's Cloud dashboard with the **Go to chart** button. -The active alarm information gives you in-depth information about the alarm that's been triggered. You can see the -alarm's configuration, how it calculates warning or critical alarms, and which configuration file you could edit on that -node if you want to tweak or disable the alarm to better suit your needs. +The active alarm information gives you details about the alarm that's been triggered. You can see the alarm's +configuration, how it calculates warning or critical alarms, and which configuration file you could edit on that node if +you want to tweak or disable the alarm to better suit your needs. 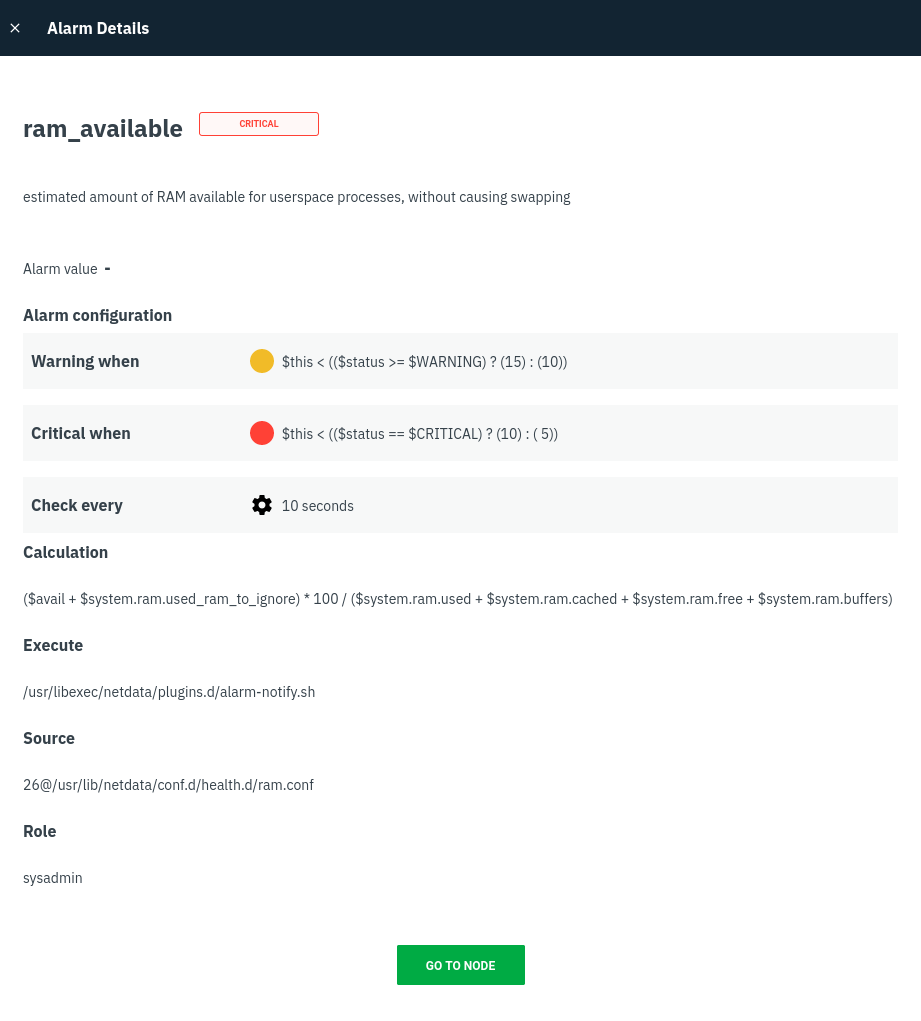 |