diff options
| author | Joel Hans <joel@netdata.cloud> | 2019-10-03 09:24:00 -0700 |
|---|---|---|
| committer | GitHub <noreply@github.com> | 2019-10-03 09:24:00 -0700 |
| commit | 2cb939c3114de63836f40ee38373956afaebde35 (patch) | |
| tree | 314d7237d796fb6b5a98003607477b9fe8ebdab5 /docs/getting-started.md | |
| parent | bfae683664b488df91940a81760459db2b18983c (diff) | |
Fixing broken links found via linkchecker (#6983)
* Fixing links with workarounds and linkchecker
* A few linter fixes
Diffstat (limited to 'docs/getting-started.md')
| -rw-r--r-- | docs/getting-started.md | 12 |
1 files changed, 6 insertions, 6 deletions
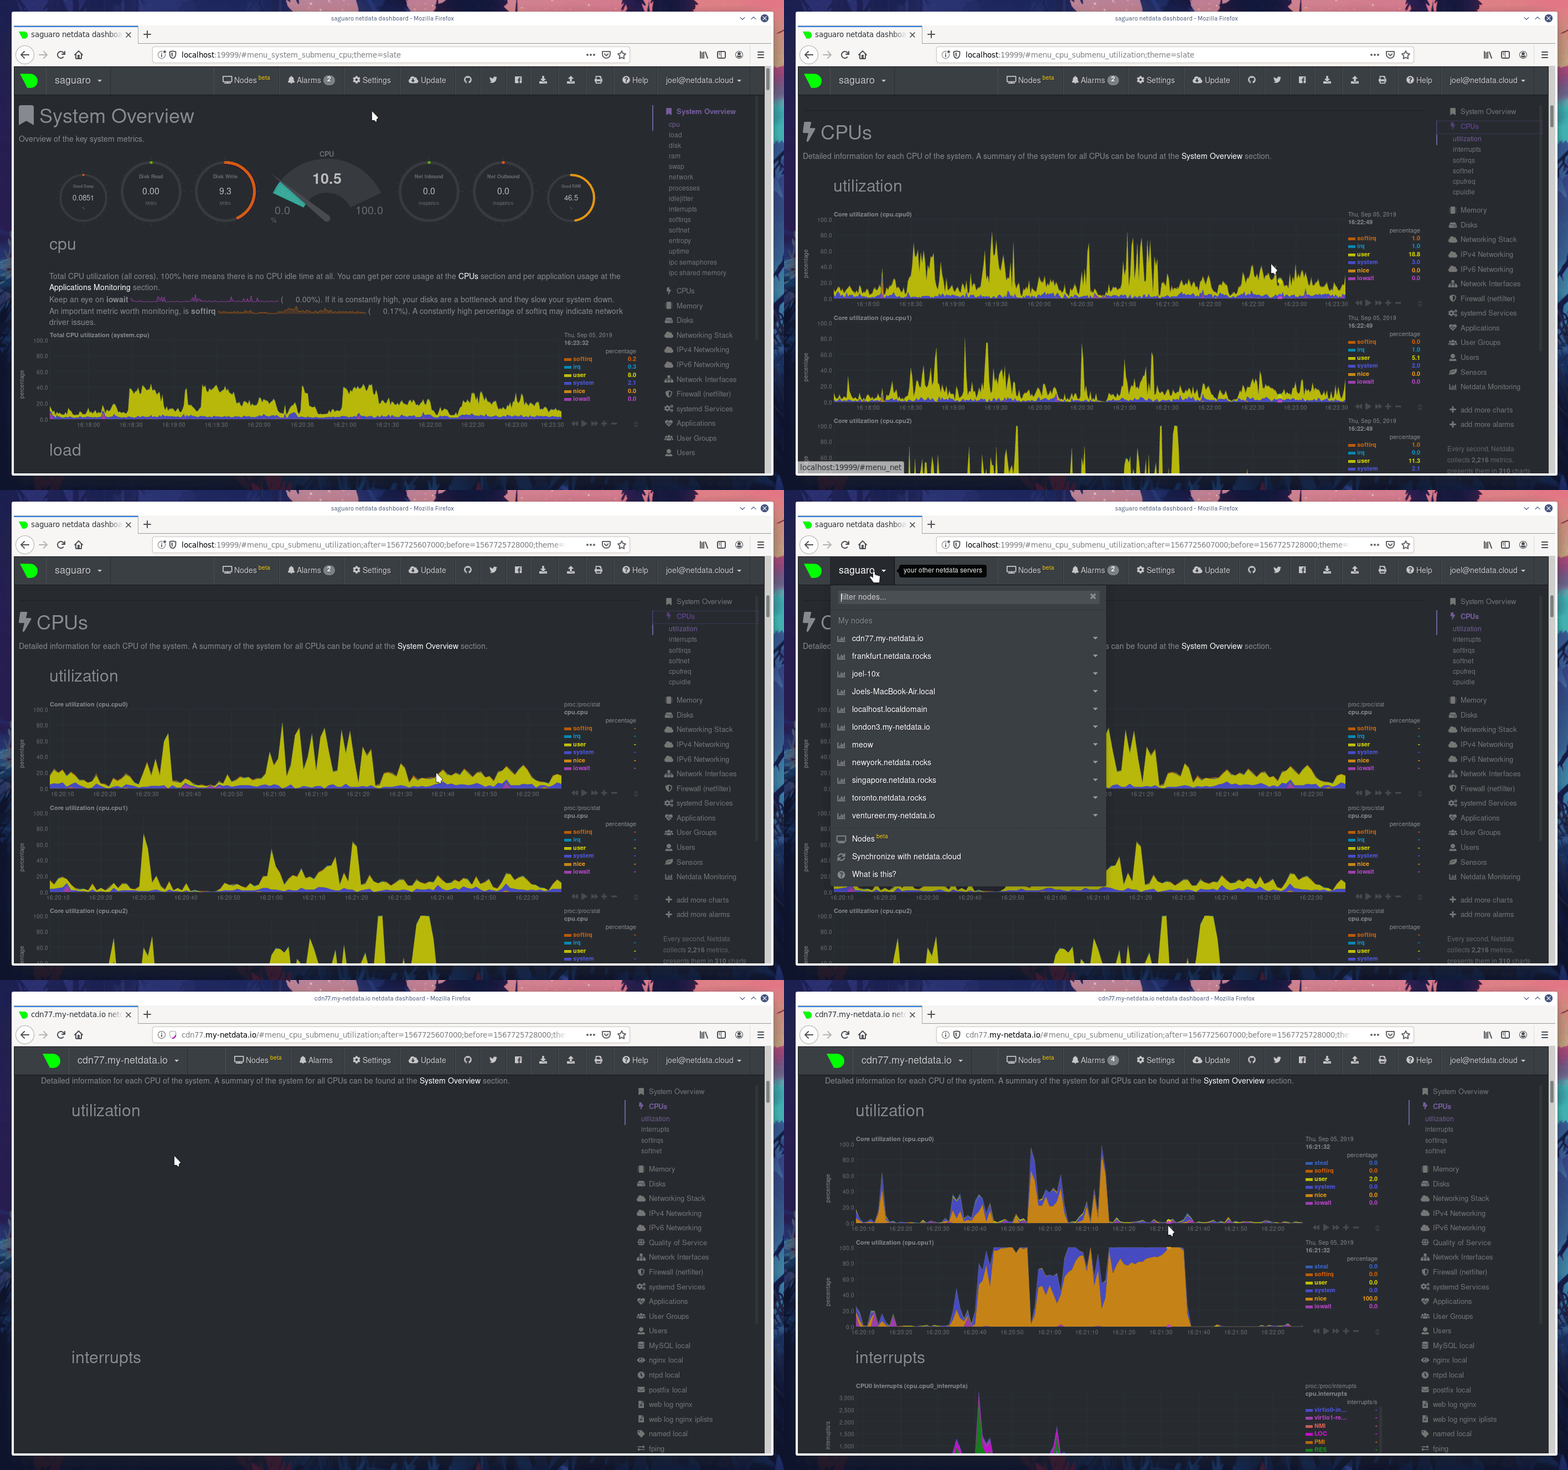
diff --git a/docs/getting-started.md b/docs/getting-started.md index 86cc8920a2..ce35581920 100644 --- a/docs/getting-started.md +++ b/docs/getting-started.md @@ -167,7 +167,7 @@ There are two quick ways to increase the depth of historical metrics: increase t that's enabled by default, or switch to the database engine. We have a tutorial that walks you through both options: [**Changing how long Netdata stores -metrics**](tutorials/longer-metrics-storage.md). +metrics**](../docs/tutorials/longer-metrics-storage.md). **What's next?**: @@ -181,9 +181,9 @@ metrics**](tutorials/longer-metrics-storage.md). If you have Netdata installed on multiple systems, you can have them all appear in the **My nodes** menu at the top-left corner of the dashboard. -To show all your servers in that menu, you need to [register for or sign in](netdata-cloud/signing-in.md) to [Netdata -Cloud](netdata-cloud/) from each system. Each system will then appear in the **My nodes** menu, which you can use to -navigate between your systems quickly. +To show all your servers in that menu, you need to [register for or sign in](../docs/netdata-cloud/signing-in.md) to +[Netdata Cloud](../docs/netdata-cloud/) from each system. Each system will then appear in the **My nodes** menu, which +you can use to navigate between your systems quickly.  @@ -198,7 +198,7 @@ You can now seamlessly track performance anomalies across your entire infrastruc - Read up on how the [Netdata Cloud registry works](../registry/), and what kind of data it stores and sends to your web browser. -- Familiarize yourself with the [Nodes View](netdata-cloud/nodes-view.md) +- Familiarize yourself with the [Nodes View](../docs/netdata-cloud/nodes-view.md) ## Start, stop, and restart Netdata @@ -228,6 +228,6 @@ Take a look at some more advanced features and configurations: - Improve security by putting Netdata behind an [Nginx proxy with SSL](Running-behind-nginx.md). Or, learn more about how you can contribute to [Netdata core](../CONTRIBUTING.md) or our -[documentation](contributing/contributing-documentation.md)! +[documentation](../docs/contributing/contributing-documentation.md)! [](<>) |
