diff options
| author | Fotis Voutsas <fotis@netdata.cloud> | 2024-05-21 12:58:32 +0300 |
|---|---|---|
| committer | GitHub <noreply@github.com> | 2024-05-21 12:58:32 +0300 |
| commit | d3ff7e981896461e416c30e456d2f243b0b69ac1 (patch) | |
| tree | ba56d8410d71103104653730f35127fe1b50b910 /docs/developer-and-contributor-corner | |
| parent | 97004af2a63c97f821ab91b2d4be4a3e0c7ccd27 (diff) | |
PR to change absolute links to relative (#17720)
Diffstat (limited to 'docs/developer-and-contributor-corner')
14 files changed, 98 insertions, 112 deletions
diff --git a/docs/developer-and-contributor-corner/collect-apache-nginx-web-logs.md b/docs/developer-and-contributor-corner/collect-apache-nginx-web-logs.md index 055219935b..206c1e8eec 100644 --- a/docs/developer-and-contributor-corner/collect-apache-nginx-web-logs.md +++ b/docs/developer-and-contributor-corner/collect-apache-nginx-web-logs.md @@ -8,7 +8,7 @@ You can use the [LTSV log format](http://ltsv.org/), track TLS and cipher usage, ever. In one test on a system with SSD storage, the collector consistently parsed the logs for 200,000 requests in 200ms, using ~30% of a single core. -The [web_log](https://github.com/netdata/netdata/blob/master/src/go/collectors/go.d.plugin/modules/weblog/README.md) collector is currently compatible +The [web_log](/src/go/collectors/go.d.plugin/modules/weblog/README.md) collector is currently compatible with [Nginx](https://nginx.org/en/) and [Apache](https://httpd.apache.org/). This guide will walk you through using the new Go-based web log collector to turn the logs these web servers @@ -82,7 +82,7 @@ jobs: ``` Restart Netdata with `sudo systemctl restart netdata`, or the [appropriate -method](https://github.com/netdata/netdata/blob/master/packaging/installer/README.md#maintaining-a-netdata-agent-installation) for your system. Netdata should pick up your web server's access log and +method](/packaging/installer/README.md#maintaining-a-netdata-agent-installation) for your system. Netdata should pick up your web server's access log and begin showing real-time charts! ### Custom log formats and fields @@ -91,7 +91,7 @@ The web log collector is capable of parsing custom Nginx and Apache log formats leave that topic for a separate guide. We do have [extensive -documentation](https://github.com/netdata/netdata/blob/master/src/go/collectors/go.d.plugin/modules/weblog/README.md#custom-log-format) on how +documentation](/src/go/collectors/go.d.plugin/modules/weblog/README.md#custom-log-format) on how to build custom parsing for Nginx and Apache logs. ## Tweak web log collector alerts @@ -109,4 +109,4 @@ You can also edit this file directly with `edit-config`: ``` For more information about editing the defaults or writing new alert entities, see our -[health monitoring documentation](https://github.com/netdata/netdata/blob/master/src/health/README.md). +[health monitoring documentation](/src/health/README.md). diff --git a/docs/developer-and-contributor-corner/collect-unbound-metrics.md b/docs/developer-and-contributor-corner/collect-unbound-metrics.md index 5467592a07..d80e8151a0 100644 --- a/docs/developer-and-contributor-corner/collect-unbound-metrics.md +++ b/docs/developer-and-contributor-corner/collect-unbound-metrics.md @@ -59,7 +59,7 @@ You may not need to do any more configuration to have Netdata collect your Unbou If you followed the steps above to enable `remote-control` and make your Unbound files readable by Netdata, that should be enough. Restart Netdata with `sudo systemctl restart netdata`, or the [appropriate -method](https://github.com/netdata/netdata/blob/master/packaging/installer/README.md#maintaining-a-netdata-agent-installation) for your system. You should see Unbound metrics in your Netdata +method](/packaging/installer/README.md#maintaining-a-netdata-agent-installation) for your system. You should see Unbound metrics in your Netdata dashboard! 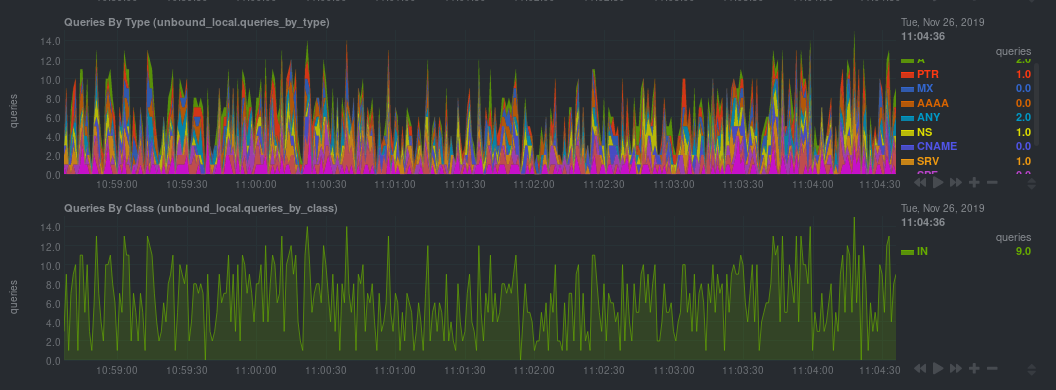 @@ -104,7 +104,7 @@ Netdata will attempt to read `unbound.conf` to get the appropriate `address`, `c `tls_key` parameters. Restart Netdata with `sudo systemctl restart netdata`, or the [appropriate -method](https://github.com/netdata/netdata/blob/master/packaging/installer/README.md#maintaining-a-netdata-agent-installation) for your system. +method](/packaging/installer/README.md#maintaining-a-netdata-agent-installation) for your system. ### Manual setup for a remote Unbound server diff --git a/docs/developer-and-contributor-corner/customize.md b/docs/developer-and-contributor-corner/customize.md index 6e994f0d8a..03a6a842a1 100644 --- a/docs/developer-and-contributor-corner/customize.md +++ b/docs/developer-and-contributor-corner/customize.md @@ -2,9 +2,9 @@ > ### Disclaimer > -> This document is only applicable to the v1 version of the dashboard and doesn't affect the [Netdata Dashboard](https://github.com/netdata/netdata/blob/master/docs/dashboards-and-charts/README.md). +> This document is only applicable to the v1 version of the dashboard and doesn't affect the [Netdata Dashboard](/docs/dashboards-and-charts/README.md). -While the [Netdata dashboard](https://github.com/netdata/netdata/blob/master/src/web/gui/README.md) comes preconfigured with hundreds of charts and +While the [Netdata dashboard](/src/web/gui/README.md) comes preconfigured with hundreds of charts and thousands of metrics, you may want to alter your experience based on a particular use case or preferences. ## Dashboard settings @@ -64,7 +64,7 @@ Edit the file with customizations to the `title`, `icon`, and `info` fields. Rep icon from [Font Awesome](https://fontawesome.com/cheatsheet) to customize the icons that appear throughout the dashboard. -Save the file, then navigate to your [Netdata config directory](https://github.com/netdata/netdata/blob/master/docs/netdata-agent/configuration/README.md) to edit `netdata.conf`. Add +Save the file, then navigate to your [Netdata config directory](/docs/netdata-agent/configuration/README.md) to edit `netdata.conf`. Add the following line to the `[web]` section to tell Netdata where to find your custom configuration. ```conf diff --git a/docs/developer-and-contributor-corner/kubernetes-k8s-netdata.md b/docs/developer-and-contributor-corner/kubernetes-k8s-netdata.md index 3f34071dd3..92f4d2f085 100644 --- a/docs/developer-and-contributor-corner/kubernetes-k8s-netdata.md +++ b/docs/developer-and-contributor-corner/kubernetes-k8s-netdata.md @@ -38,7 +38,7 @@ To follow this tutorial, you need: - A free Netdata Cloud account. [Sign up](https://app.netdata.cloud/sign-up?cloudRoute=/spaces) if you don't have one already. - A working cluster running Kubernetes v1.9 or newer, with a Netdata deployment and connected parent/child nodes. See - our [Kubernetes deployment process](https://github.com/netdata/netdata/blob/master/packaging/installer/methods/kubernetes.md) for details on deployment and + our [Kubernetes deployment process](/packaging/installer/methods/kubernetes.md) for details on deployment and conneting to Cloud. - The [`kubectl`](https://kubernetes.io/docs/reference/kubectl/overview/) command line tool, within [one minor version difference](https://kubernetes.io/docs/tasks/tools/install-kubectl/#before-you-begin) of your cluster, on an @@ -123,7 +123,7 @@ visualizations](https://user-images.githubusercontent.com/1153921/109049195-349f ### Health map -The first visualization is the [health map](https://github.com/netdata/netdata/blob/master/docs/dashboards-and-charts/kubernetes-tab.md#health-map), +The first visualization is the [health map](/docs/dashboards-and-charts/kubernetes-tab.md#health-map), which places each container into its own box, then varies the intensity of their color to visualize the resource utilization. By default, the health map shows the **average CPU utilization as a percentage of the configured limit** for every container in your cluster. @@ -137,7 +137,7 @@ Let's explore the most colorful box by hovering over it. container](https://user-images.githubusercontent.com/1153921/109049544-a8417980-7695-11eb-80a7-109b4a645a27.png) The **Context** tab shows `rabbitmq-5bb66bb6c9-6xr5b` as the container's image name, which means this container is -running a [RabbitMQ](https://github.com/netdata/netdata/blob/master/src/go/collectors/go.d.plugin/modules/rabbitmq/README.md) workload. +running a [RabbitMQ](/src/go/collectors/go.d.plugin/modules/rabbitmq/README.md) workload. Click the **Metrics** tab to see real-time metrics from that container. Unsurprisingly, it shows a spike in CPU utilization at regular intervals. @@ -156,7 +156,7 @@ different namespaces. 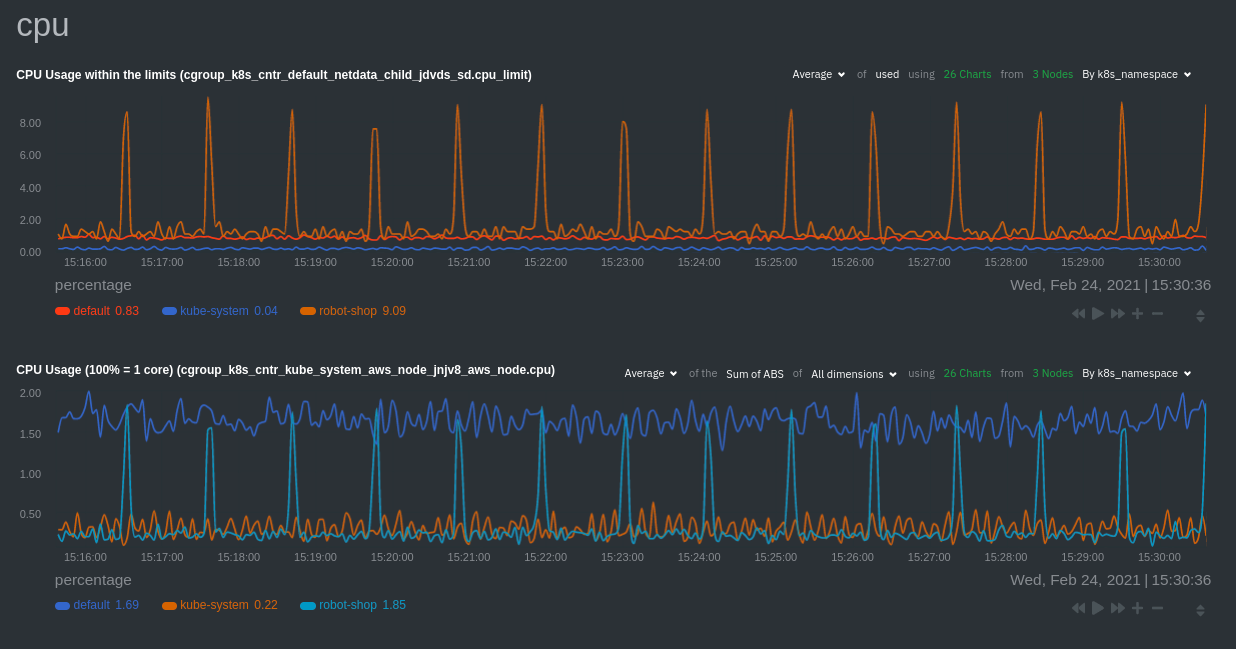 -Each composite chart has a [definition bar](https://github.com/netdata/netdata/blob/master/docs/dashboards-and-charts/netdata-charts.md#definition-bar) +Each composite chart has a [definition bar](/docs/dashboards-and-charts/netdata-charts.md#definition-bar) for complete customization. For example, grouping the top chart by `k8s_container_name` reveals new information. 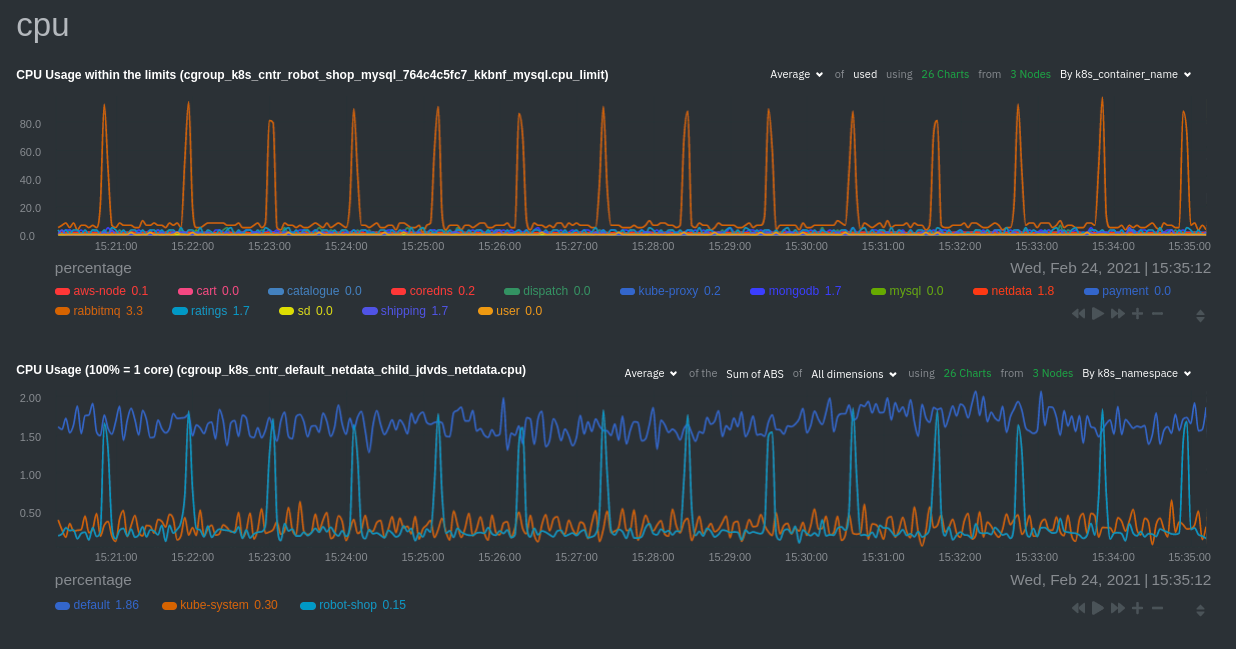 @@ -166,20 +166,20 @@ for complete customization. For example, grouping the top chart by `k8s_containe Netdata has a [service discovery plugin](https://github.com/netdata/agent-service-discovery), which discovers and creates configuration files for [compatible services](https://github.com/netdata/helmchart#service-discovery-and-supported-services) and any endpoints covered by -our [generic Prometheus collector](https://github.com/netdata/netdata/blob/master/src/go/collectors/go.d.plugin/modules/prometheus/README.md). +our [generic Prometheus collector](/src/go/collectors/go.d.plugin/modules/prometheus/README.md). Netdata uses these files to collect metrics from any compatible application as they run _inside_ of a pod. Service discovery happens without manual intervention as pods are created, destroyed, or moved between nodes. Service metrics show up on the Overview as well, beneath the **Kubernetes** section, and are labeled according to the service in question. For example, the **RabbitMQ** section has numerous charts from the [`rabbitmq` -collector](https://github.com/netdata/netdata/blob/master/src/go/collectors/go.d.plugin/modules/rabbitmq/README.md): +collector](/src/go/collectors/go.d.plugin/modules/rabbitmq/README.md): 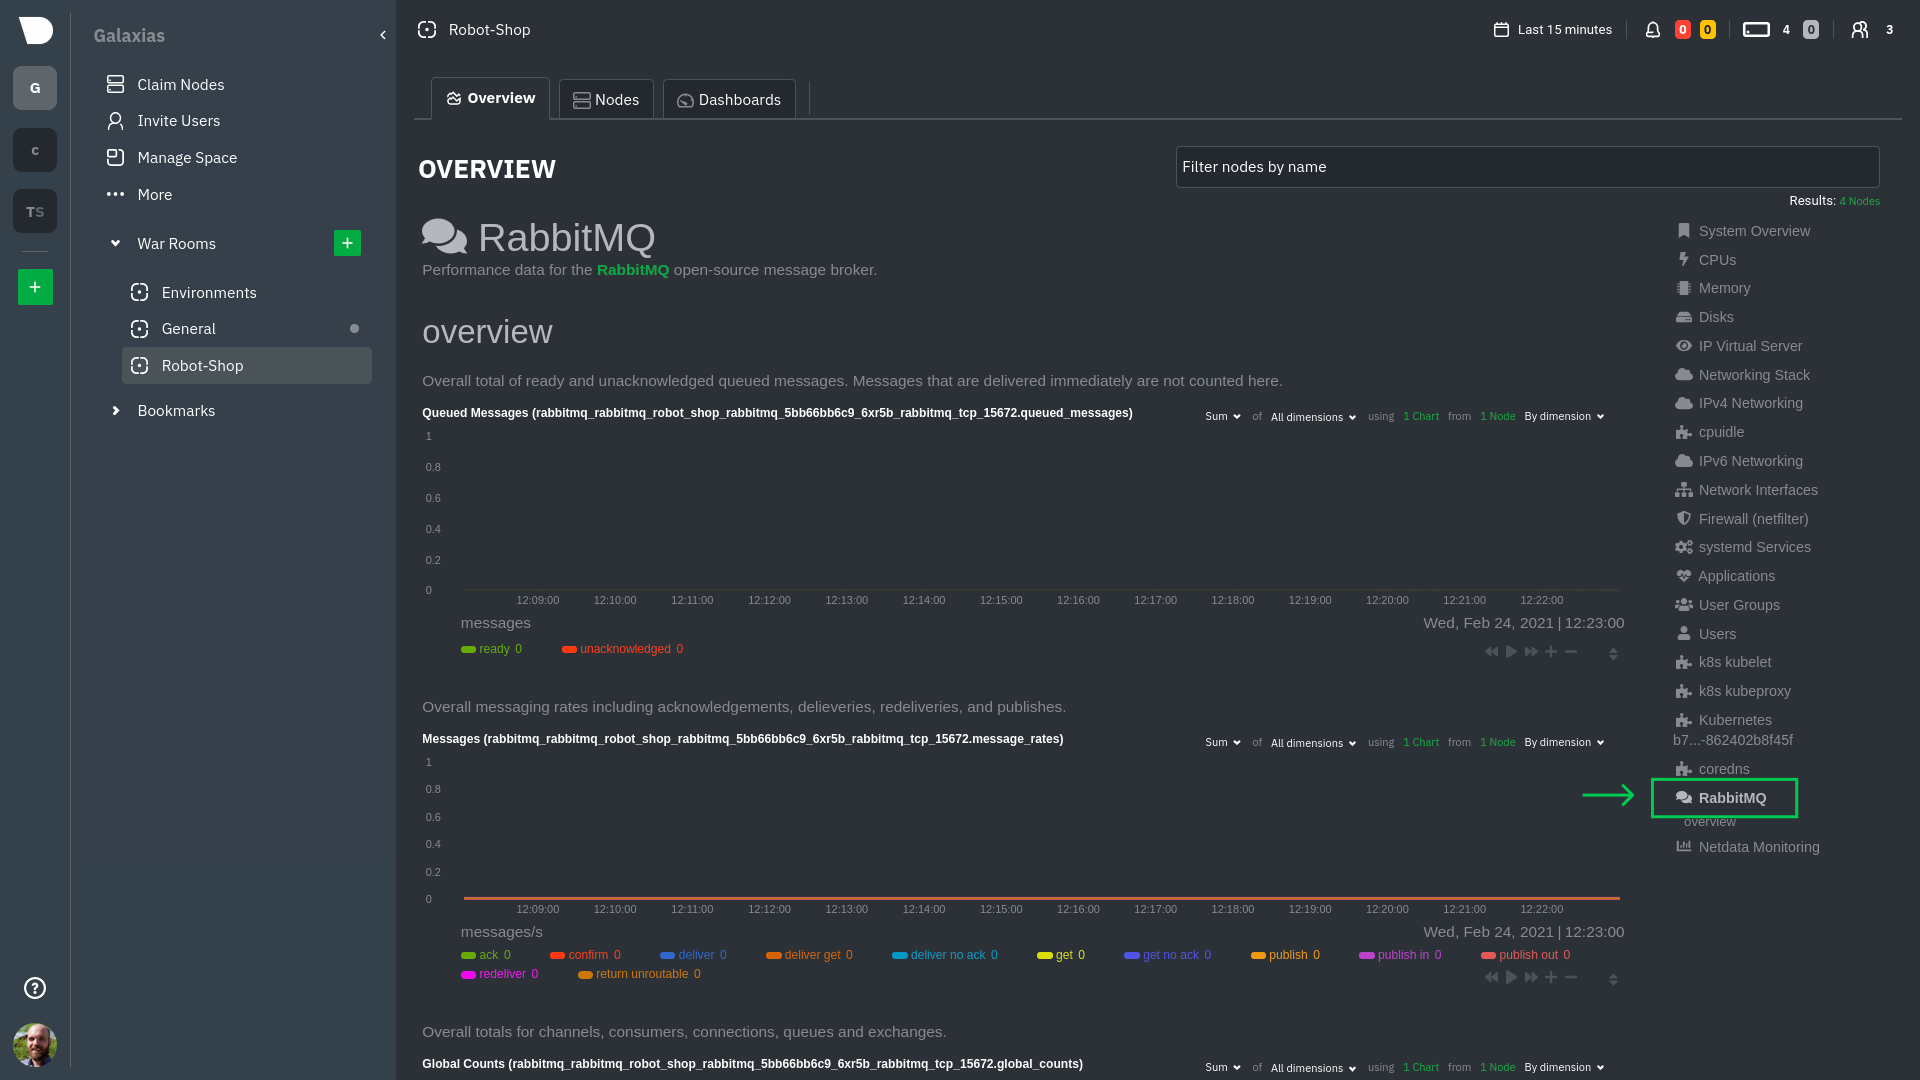 > The robot-shop cluster has more supported services, such as MySQL, which are not visible with zero configuration. This > is usually because of services running on non-default ports, using non-default names, or required passwords. Read up -> on [configuring service discovery](https://github.com/netdata/netdata/blob/master/packaging/installer/methods/kubernetes.md#configure-service-discovery) to collect +> on [configuring service discovery](/packaging/installer/methods/kubernetes.md#configure-service-discovery) to collect > more service metrics. Service metrics are essential to infrastructure monitoring, as they're the best indicator of the end-user experience, @@ -193,7 +193,7 @@ Netdata also automatically collects metrics from two essential Kubernetes proces The **k8s kubelet** section visualizes metrics from the Kubernetes agent responsible for managing every pod on a given node. This also happens without any configuration thanks to the [kubelet -collector](https://github.com/netdata/netdata/blob/master/src/go/collectors/go.d.plugin/modules/k8s_kubelet/README.md). +collector](/src/go/collectors/go.d.plugin/modules/k8s_kubelet/README.md). Monitoring each node's kubelet can be invaluable when diagnosing issues with your Kubernetes cluster. For example, you can see if the number of running containers/pods has dropped, which could signal a fault or crash in a particular @@ -209,7 +209,7 @@ configuration-related errors, and the actual vs. desired numbers of volumes, plu The **k8s kube-proxy** section displays metrics about the network proxy that runs on each node in your Kubernetes cluster. kube-proxy lets pods communicate with each other and accept sessions from outside your cluster. Its metrics are collected by the [kube-proxy -collector](https://github.com/netdata/netdata/blob/master/src/go/collectors/go.d.plugin/modules/k8s_kubeproxy/README.md). +collector](/src/go/collectors/go.d.plugin/modules/k8s_kubeproxy/README.md). With Netdata, you can monitor how often your k8s proxies are syncing proxy rules between nodes. Dramatic changes in these figures could indicate an anomaly in your cluster that's worthy of further investigation. @@ -229,9 +229,9 @@ clusters of all sizes. - [Netdata Helm chart](https://github.com/netdata/helmchart) - [Netdata service discovery](https://github.com/netdata/agent-service-discovery) - [Netdata Agent · `kubelet` - collector](https://github.com/netdata/netdata/blob/master/src/go/collectors/go.d.plugin/modules/k8s_kubelet/README.md) + collector](/src/go/collectors/go.d.plugin/modules/k8s_kubelet/README.md) - [Netdata Agent · `kube-proxy` - collector](https://github.com/netdata/netdata/blob/master/src/go/collectors/go.d.plugin/modules/k8s_kubeproxy/README.md) -- [Netdata Agent · `cgroups.plugin`](https://github.com/netdata/netdata/blob/master/src/collectors/cgroups.plugin/README.md) + collector](/src/go/collectors/go.d.plugin/modules/k8s_kubeproxy/README.md) +- [Netdata Agent · `cgroups.plugin`](/src/collectors/cgroups.plugin/README.md) diff --git a/docs/developer-and-contributor-corner/lamp-stack.md b/docs/developer-and-contributor-corner/lamp-stack.md index aa11a749e4..da2d3c95a8 100644 --- a/docs/developer-and-contributor-corner/lamp-stack.md +++ b/docs/developer-and-contributor-corner/lamp-stack.md @@ -51,7 +51,7 @@ To follow this tutorial, you need: ## Install the Netdata Agent If you don't have the free, open-source Netdata monitoring agent installed on your node yet, get started with a [single -kickstart command](https://github.com/netdata/netdata/blob/master/packaging/installer/README.md): +kickstart command](/packaging/installer/README.md): <OneLineInstallWget/> @@ -61,15 +61,15 @@ replacing `NODE` with the hostname or IP address of your system. ## Enable hardware and Linux system monitoring -There's nothing you need to do to enable [system monitoring](https://github.com/netdata/netdata/blob/master/docs/collecting-metrics/system-metrics.md) and Linux monitoring with +There's nothing you need to do to enable [system monitoring](/docs/collecting-metrics/system-metrics.md) and Linux monitoring with the Netdata Agent, which autodetects metrics from CPUs, memory, disks, networking devices, and Linux processes like systemd without any configuration. If you're using containers, Netdata automatically collects resource utilization -metrics from each using the [cgroups data collector](https://github.com/netdata/netdata/blob/master/src/collectors/cgroups.plugin/README.md). +metrics from each using the [cgroups data collector](/src/collectors/cgroups.plugin/README.md). ## Enable Apache monitoring Let's begin by configuring Apache to work with Netdata's [Apache data -collector](https://github.com/netdata/netdata/blob/master/src/go/collectors/go.d.plugin/modules/apache/README.md). +collector](/src/go/collectors/go.d.plugin/modules/apache/README.md). Actually, there's nothing for you to do to enable Apache monitoring with Netdata. @@ -80,7 +80,7 @@ metrics](https://httpd.apache.org/docs/2.4/mod/mod_status.html), which is just _ ## Enable web log monitoring The Netdata Agent also comes with a [web log -collector](https://github.com/netdata/netdata/blob/master/src/go/collectors/go.d.plugin/modules/weblog/README.md), which reads Apache's access +collector](/src/go/collectors/go.d.plugin/modules/weblog/README.md), which reads Apache's access log file, processes each line, and converts them into per-second metrics. On Debian systems, it reads the file at `/var/log/apache2/access.log`. @@ -93,7 +93,7 @@ monitoring. Because your MySQL database is password-protected, you do need to tell MySQL to allow the `netdata` user to connect to without a password. Netdata's [MySQL data -collector](https://github.com/netdata/netdata/blob/master/src/go/collectors/go.d.plugin/modules/mysql/README.md) collects metrics in _read-only_ +collector](/src/go/collectors/go.d.plugin/modules/mysql/README.md) collects metrics in _read-only_ mode, without being able to alter or affect operations in any way. First, log into the MySQL shell. Then, run the following three commands, one at a time: @@ -105,15 +105,15 @@ FLUSH PRIVILEGES; ``` Run `sudo systemctl restart netdata`, or the [appropriate alternative for your -system](https://github.com/netdata/netdata/blob/master/packaging/installer/README.md#maintaining-a-netdata-agent-installation), to collect dozens of metrics every second for robust MySQL monitoring. +system](/packaging/installer/README.md#maintaining-a-netdata-agent-installation), to collect dozens of metrics every second for robust MySQL monitoring. ## Enable PHP monitoring Unlike Apache or MySQL, PHP isn't a service that you can monitor directly, unless you instrument a PHP-based application -with [StatsD](https://github.com/netdata/netdata/blob/master/src/collectors/statsd.plugin/README.md). +with [StatsD](/src/collectors/statsd.plugin/README.md). However, if you use [PHP-FPM](https://php-fpm.org/) in your LAMP stack, you can monitor that process with our [PHP-FPM -data collector](https://github.com/netdata/netdata/blob/master/src/go/collectors/go.d.plugin/modules/phpfpm/README.md). +data collector](/src/go/collectors/go.d.plugin/modules/phpfpm/README.md). Open your PHP-FPM configuration for editing, replacing `7.4` with your version of PHP: @@ -159,12 +159,12 @@ If the Netdata Agent isn't already open in your browser, open a new tab and navi > If you [signed up](https://app.netdata.cloud/sign-up?cloudRoute=/spaces) for Netdata Cloud earlier, you can also view > the exact same LAMP stack metrics there, plus additional features, like drag-and-drop custom dashboards. Be sure to -> [connecting your node](https://github.com/netdata/netdata/blob/master/src/claim/README.md) to start streaming metrics to your browser through Netdata Cloud. +> [connecting your node](/src/claim/README.md) to start streaming metrics to your browser through Netdata Cloud. Netdata automatically organizes all metrics and charts onto a single page for easy navigation. Peek at gauges to see overall system performance, then scroll down to see more. Click-and-drag with your mouse to pan _all_ charts back and forth through different time intervals, or hold `SHIFT` and use the scrollwheel (or two-finger scroll) to zoom in and -out. Check out our doc on [interacting with charts](https://github.com/netdata/netdata/blob/master/docs/dashboards-and-charts/netdata-charts.md) for all the details. +out. Check out our doc on [interacting with charts](/docs/dashboards-and-charts/netdata-charts.md) for all the details. 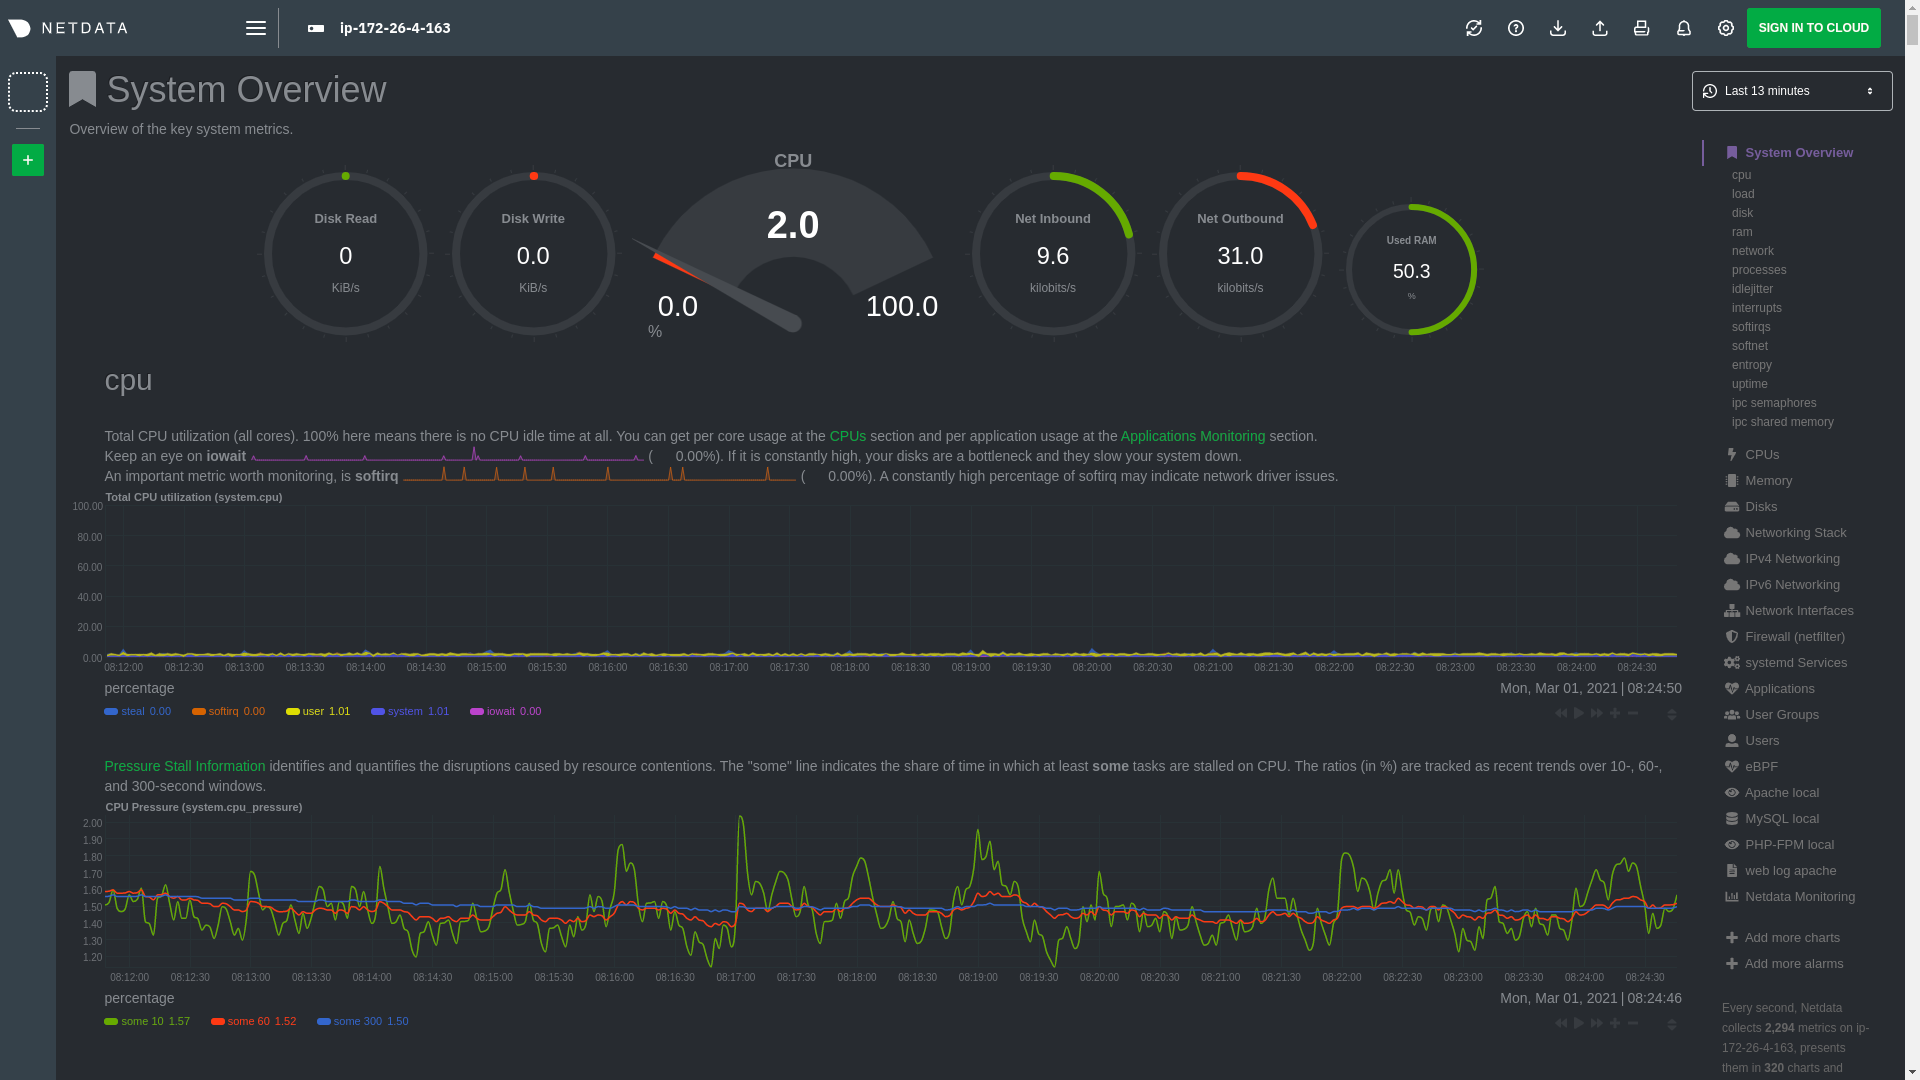 @@ -197,15 +197,15 @@ Here's a quick reference for what charts you might want to focus on after settin The Netdata Agent comes with hundreds of pre-configured alerts to help you keep tabs on your system, including 19 alerts designed for smarter LAMP stack monitoring. -Click the 🔔 icon in the top navigation to [see active alerts](https://github.com/netdata/netdata/blob/master/docs/dashboards-and-charts/alerts-tab.md). The **Active** tabs +Click the 🔔 icon in the top navigation to [see active alerts](/docs/dashboards-and-charts/alerts-tab.md). The **Active** tabs shows any alerts currently triggered, while the **All** tab displays a list of _every_ pre-configured alert. The 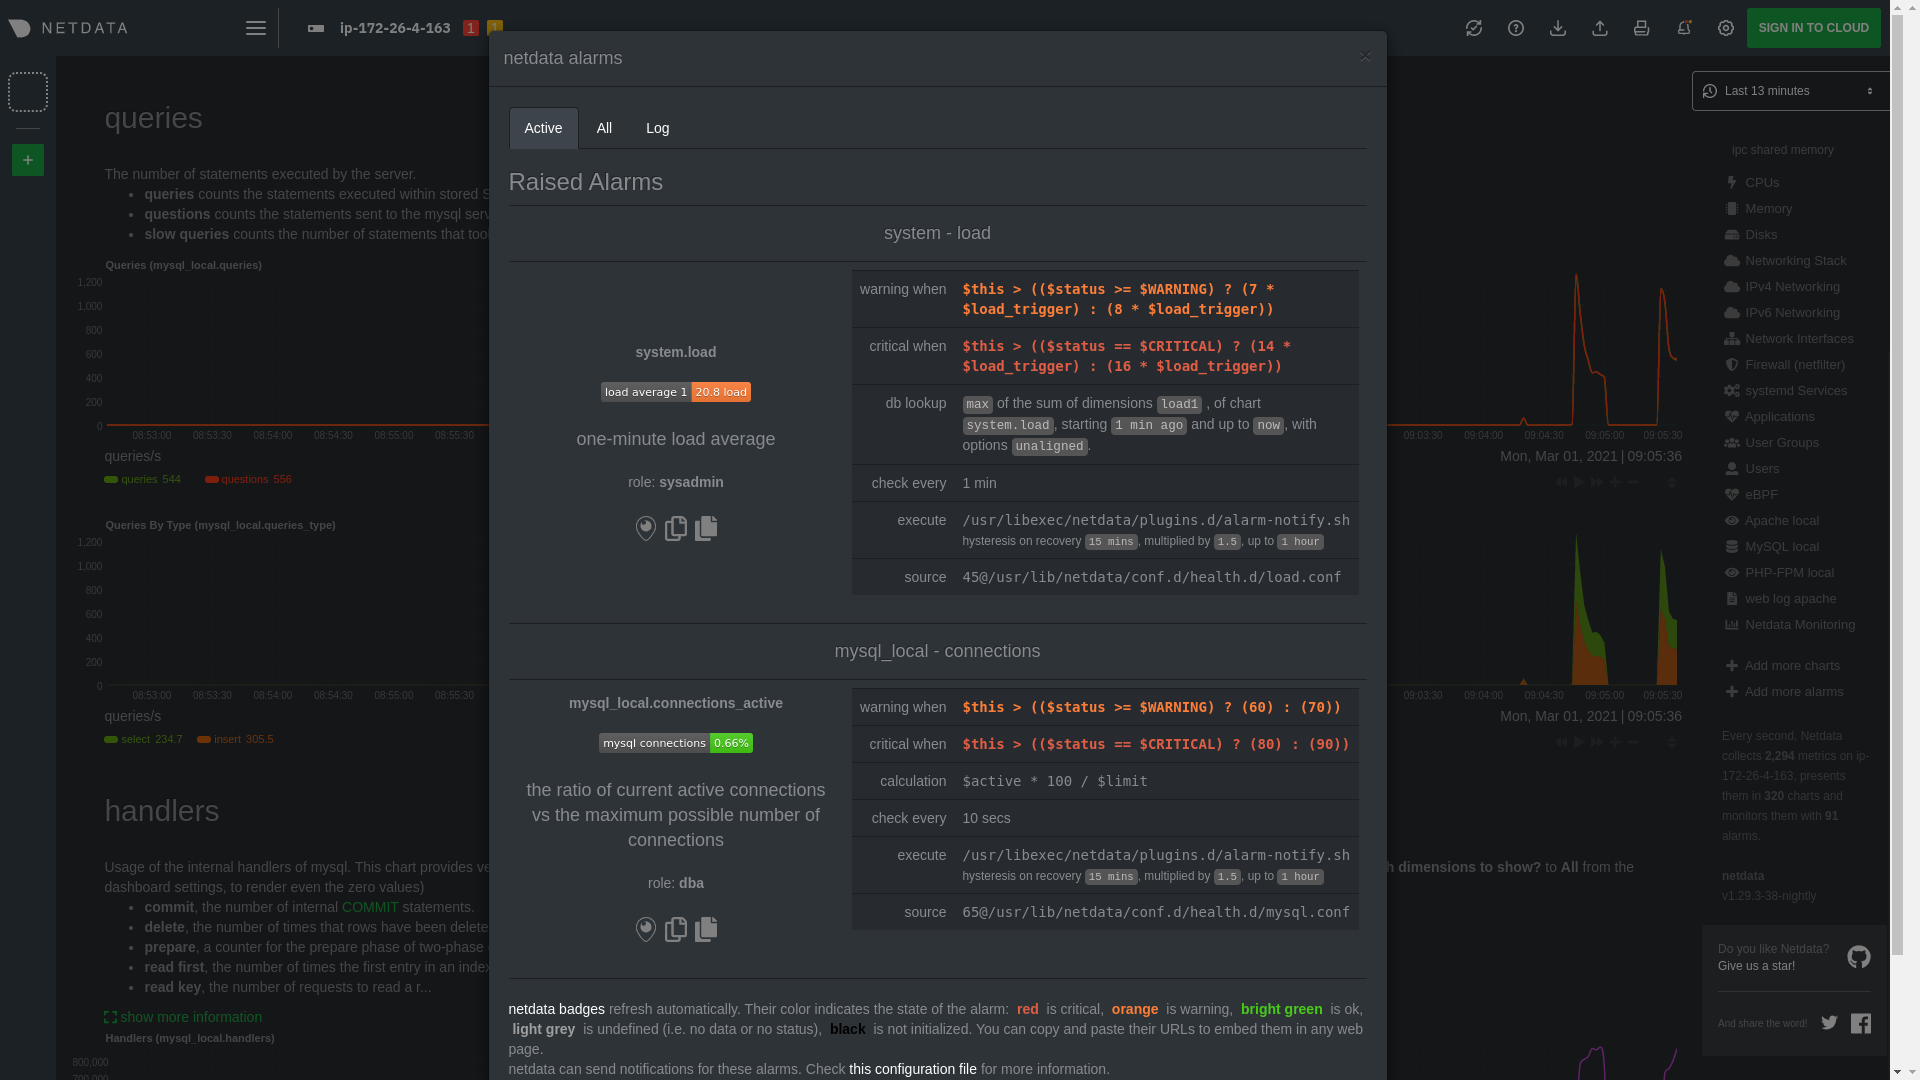 -[Tweak alerts](https://github.com/netdata/netdata/blob/master/src/health/REFERENCE.md) based on your infrastructure monitoring needs, and to see these alerts +[Tweak alerts](/src/health/REFERENCE.md) based on your infrastructure monitoring needs, and to see these alerts in other places, like your inbox or a Slack channel, [enable a notification -method](https://github.com/netdata/netdata/blob/master/docs/alerts-and-notifications/notifications/README.md). +method](/docs/alerts-and-notifications/notifications/README.md). ## What's next? @@ -215,7 +215,7 @@ services. The per-second metrics granularity means you have the most accurate in any LAMP-related issues. Another powerful way to monitor the availability of a LAMP stack is the [`httpcheck` -collector](https://github.com/netdata/netdata/blob/master/src/go/collectors/go.d.plugin/modules/httpcheck/README.md), which pings a web server at +collector](/src/go/collectors/go.d.plugin/modules/httpcheck/README.md), which pings a web server at a regular interval and tells you whether if and how quickly it's responding. The `response_match` option also lets you monitor when the web server's response isn't what you expect it to be, which might happen if PHP-FPM crashes, for example. @@ -225,14 +225,14 @@ we're not covering it here, but it _does_ work in a single-node setup. Just don' node crashed. If you're planning on managing more than one node, or want to take advantage of advanced features, like finding the -source of issues faster with [Metric Correlations](https://github.com/netdata/netdata/blob/master/docs/metric-correlations.md), +source of issues faster with [Metric Correlations](/docs/metric-correlations.md), [sign up](https://app.netdata.cloud/sign-up?cloudRoute=/spaces) for a free Netdata Cloud account. ### Related reference documentation -- [Netdata Agent · Get started](https://github.com/netdata/netdata/blob/master/packaging/installer/README.md) -- [Netdata Agent · Apache data collector](https://github.com/netdata/netdata/blob/master/src/go/collectors/go.d.plugin/modules/apache/README.md) -- [Netdata Agent · Web log collector](https://github.com/netdata/netdata/blob/master/src/go/collectors/go.d.plugin/modules/weblog/README.md) -- [Netdata Agent · MySQL data collector](https://github.com/netdata/netdata/blob/master/src/go/collectors/go.d.plugin/modules/mysql/README.md) -- [Netdata Agent · PHP-FPM data collector](https://github.com/netdata/netdata/blob/master/src/go/collectors/go.d.plugin/modules/phpfpm/README.md) +- [Netdata Agent · Get started](/packaging/installer/README.md) +- [Netdata Agent · Apache data collector](/src/go/collectors/go.d.plugin/modules/apache/README.md) +- [Netdata Agent · Web log collector](/src/go/collectors/go.d.plugin/modules/weblog/README.md) +- [Netdata Agent · MySQL data collector](/src/go/collectors/go.d.plugin/modules/mysql/README.md) +- [Netdata Agent · PHP-FPM data collector](/src/go/collectors/go.d.plugin/modules/phpfpm/README.md) diff --git a/docs/developer-and-contributor-corner/monitor-cockroachdb.md b/docs/developer-and-contributor-corner/monitor-cockroachdb.md index 9d4d3ea03c..303c00f620 100644 --- a/docs/developer-and-contributor-corner/monitor-cockroachdb.md +++ b/docs/developer-and-contributor-corner/monitor-cockroachdb.md @@ -11,7 +11,7 @@ learn_rel_path: "Miscellaneous" [CockroachDB](https://github.com/cockroachdb/cockroach) is an open-source project that brings SQL databases into scalable, disaster-resilient cloud deployments. Thanks to -a [new CockroachDB collector](https://github.com/netdata/netdata/blob/master/src/go/collectors/go.d.plugin/modules/cockroachdb/README.md) +a [new CockroachDB collector](/src/go/collectors/go.d.plugin/modules/cockroachdb/README.md) released in [v1.20](https://blog.netdata.cloud/posts/release-1.20/), you can now monitor any number of CockroachDB databases with maximum granularity using Netdata. Collect more than 50 unique metrics and put them on interactive visualizations @@ -38,7 +38,7 @@ display them on the dashboard. If your CockroachDB instance is accessible through `http://localhost:8080/` or `http://127.0.0.1:8080`, your setup is complete. Restart Netdata with `sudo systemctl restart netdata`, or the [appropriate -method](https://github.com/netdata/netdata/blob/master/packaging/installer/README.md#maintaining-a-netdata-agent-installation) for your system, and refresh your browser. You should see CockroachDB +method](/packaging/installer/README.md#maintaining-a-netdata-agent-installation) for your system, and refresh your browser. You should see CockroachDB metrics in your Netdata dashboard! <figure> @@ -115,4 +115,4 @@ cd /etc/netdata/ # Replace with your Netdata configuration directory, if not /et ./edit-config health.d/cockroachdb.conf # You may need to use `sudo` for write privileges ``` -For more information about editing the defaults or writing new alert entities, see our documentation on [configuring health alerts](https://github.com/netdata/netdata/blob/master/src/health/REFERENCE.md). +For more information about editing the defaults or writing new alert entities, see our documentation on [configuring health alerts](/src/health/REFERENCE.md). diff --git a/docs/developer-and-contributor-corner/monitor-debug-applications-ebpf.md b/docs/developer-and-contributor-corner/monitor-debug-applications-ebpf.md index 9be0ba5751..f84ee14eb1 100644 --- a/docs/developer-and-contributor-corner/monitor-debug-applications-ebpf.md +++ b/docs/developer-and-contributor-corner/monitor-debug-applications-ebpf.md @@ -12,7 +12,7 @@ learn_rel_path: "Operations" When trying to troubleshoot or debug a finicky application, there's no such thing as too much information. At Netdata, we developed programs that connect to the [_extended Berkeley Packet Filter_ (eBPF) virtual -machine](https://github.com/netdata/netdata/blob/master/src/collectors/ebpf.plugin/README.md) to help you see exactly how specific applications are interacting with the +machine](/src/collectors/ebpf.plugin/README.md) to help you see exactly how specific applications are interacting with the Linux kernel. With these charts, you can root out bugs, discover optimizations, diagnose memory leaks, and much more. This means you can see exactly how often, and in what volume, the application creates processes, opens files, writes to @@ -29,7 +29,7 @@ To start troubleshooting an application with eBPF metrics, you need to ensure yo displays those metrics independent from any other process. You can use the `apps_groups.conf` file to configure which applications appear in charts generated by -[`apps.plugin`](https://github.com/netdata/netdata/blob/master/src/collectors/apps.plugin/README.md). Once you edit this file and create a new group for the application +[`apps.plugin`](/src/collectors/apps.plugin/README.md). Once you edit this file and create a new group for the application you want to monitor, you can see how it's interacting with the Linux kernel via real-time eBPF metrics. Let's assume you have an application that runs on the process `custom-app`. To monitor eBPF metrics for that application @@ -61,12 +61,12 @@ dev: custom-app ``` Restart Netdata with `sudo systemctl restart netdata`, or the [appropriate -method](https://github.com/netdata/netdata/blob/master/packaging/installer/README.md#maintaining-a-netdata-agent-installation) for your system, to begin seeing metrics for this particular +method](/packaging/installer/README.md#maintaining-a-netdata-agent-installation) for your system, to begin seeing metrics for this particular group+process. You can also add additional processes to the same group. You can set up `apps_groups.conf` to more show more precise eBPF metrics for any application or service running on your system, even if it's a standard package like Redis, Apache, or any other [application/service Netdata collects -from](https://github.com/netdata/netdata/blob/master/src/collectors/COLLECTORS.md). +from](/src/collectors/COLLECTORS.md). ```conf # ----------------------------------------------------------------------------- @@ -86,7 +86,7 @@ to show other charts that will help you debug and troubleshoot how it interacts ## Configure the eBPF collector to monitor errors -The eBPF collector has [two possible modes](https://github.com/netdata/netdata/blob/master/src/collectors/ebpf.plugin/README.md#ebpf-load-mode): `entry` and `return`. The default +The eBPF collector has [two possible modes](/src/collectors/ebpf.plugin/README.md#ebpf-load-mode): `entry` and `return`. The default is `entry`, and only monitors calls to kernel functions, but the `return` also monitors and charts _whether these calls return in error_. @@ -110,7 +110,7 @@ Replace `entry` with `return`: ``` Restart Netdata with `sudo systemctl restart netdata`, or the [appropriate -method](https://github.com/netdata/netdata/blob/master/packaging/installer/README.md#maintaining-a-netdata-agent-installation) for your system. +method](/packaging/installer/README.md#maintaining-a-netdata-agent-installation) for your system. ## Get familiar with per-application eBPF metrics and charts @@ -122,7 +122,7 @@ Pay particular attention to the charts in the **ebpf file**, **ebpf syscall**, * sub-sections. These charts are populated by low-level Linux kernel metrics thanks to eBPF, and showcase the volume of calls to open/close files, call functions like `do_fork`, IO activity on the VFS, and much more. -See the [eBPF collector documentation](https://github.com/netdata/netdata/blob/master/src/collectors/ebpf.plugin/README.md#integration-with-appsplugin) for the full list +See the [eBPF collector documentation](/src/collectors/ebpf.plugin/README.md#integration-with-appsplugin) for the full list of per-application charts. Let's show some examples of how you can first identify normal eBPF patterns, then use that knowledge to identify @@ -239,16 +239,16 @@ same application on multiple systems and want to correlate how it performs on ea findings with someone else on your team. If you don't already have a Netdata Cloud account, go [sign in](https://app.netdata.cloud) and get started for free. -You can also read how to [monitor your infrastructure with Netdata Cloud](https://github.com/netdata/netdata/blob/master/docs/netdata-cloud/monitor-your-infrastructure.md) to understand the key features that it has to offer. +You can also read how to [monitor your infrastructure with Netdata Cloud](/docs/netdata-cloud/monitor-your-infrastructure.md) to understand the key features that it has to offer. Once you've added one or more nodes to a Space in Netdata Cloud, you can see aggregated eBPF metrics in the Overview dashboard under the same **Applications** or **eBPF** sections that you -find on the local Agent dashboard. Or, [create new dashboards](https://github.com/netdata/netdata/blob/master/docs/dashboards-and-charts/dashboards-tab.md) using eBPF metrics +find on the local Agent dashboard. Or, [create new dashboards](/docs/dashboards-and-charts/dashboards-tab.md) using eBPF metrics from any number of distributed nodes to see how your application interacts with multiple Linux kernels on multiple Linux systems. Now that you can see eBPF metrics in Netdata Cloud, you can [invite your -team](https://github.com/netdata/netdata/blob/master/docs/netdata-cloud/organize-your-infrastructure-invite-your-team.md#invite-your-team) and share your findings with others. +team](/docs/netdata-cloud/organize-your-infrastructure-invite-your-team.md#invite-your-team) and share your findings with others. diff --git a/docs/developer-and-contributor-corner/monitor-hadoop-cluster.md b/docs/developer-and-contributor-corner/monitor-hadoop-cluster.md index b536e0fa03..8ccaa935ed 100644 --- a/docs/developer-and-contributor-corner/monitor-hadoop-cluster.md +++ b/docs/developer-and-contributor-corner/monitor-hadoop-cluster.md @@ -27,8 +27,8 @@ alternative, like the guide available from For more specifics on the collection modules used in this guide, read the respective pages in our documentation: -- [HDFS](https://github.com/netdata/netdata/blob/master/src/go/collectors/go.d.plugin/modules/hdfs/README.md) -- [Zookeeper](https://github.com/netdata/netdata/blob/master/src/go/collectors/go.d.plugin/modules/zookeeper/README.md) +- [HDFS](/src/go/collectors/go.d.plugin/modules/hdfs/README.md) +- [Zookeeper](/src/go/collectors/go.d.plugin/modules/zookeeper/README.md) ## Set up your HDFS and Zookeeper installations @@ -164,7 +164,7 @@ jobs: address : 203.0.113.10:2182 ``` -Finally, [restart Netdata](https://github.com/netdata/netdata/blob/master/packaging/installer/README.md#maintaining-a-netdata-agent-installation). +Finally, [restart Netdata](/packaging/installer/README.md#maintaining-a-netdata-agent-installation). ```sh sudo systemctl restart netdata @@ -188,4 +188,4 @@ sudo /etc/netdata/edit-config health.d/zookeeper.conf ``` For more information about editing the defaults or writing new alert entities, see our -[health monitoring documentation](https://github.com/netdata/netdata/blob/master/src/health/README.md). +[health monitoring documentation](/src/health/README.md). diff --git a/docs/developer-and-contributor-corner/pi-hole-raspberry-pi.md b/docs/developer-and-contributor-corner/pi-hole-raspberry-pi.md index 0500e2c527..124b95421d 100644 --- a/docs/developer-and-contributor-corner/pi-hole-raspberry-pi.md +++ b/docs/developer-and-contributor-corner/pi-hole-raspberry-pi.md @@ -81,7 +81,7 @@ service](https://discourse.pi-hole.net/t/how-do-i-configure-my-devices-to-use-pi finished setting up Pi-hole at this point. As far as configuring Netdata to monitor Pi-hole metrics, there's nothing you actually need to do. Netdata's [Pi-hole -collector](https://github.com/netdata/netdata/blob/master/src/go/collectors/go.d.plugin/modules/pihole/README.md) will autodetect the new service +collector](/src/go/collectors/go.d.plugin/modules/pihole/README.md) will autodetect the new service running on your Raspberry Pi and immediately start collecting metrics every second. Restart Netdata with `sudo systemctl restart netdata`, which will then recognize that Pi-hole is running and start a @@ -103,9 +103,9 @@ action](https://user-images.githubusercontent.com/1153921/80827388-b9fee100-8b98 ### Enable temperature sensor monitoring You need to manually enable Netdata's built-in [temperature sensor -collector](https://github.com/netdata/netdata/blob/master/src/collectors/charts.d.plugin/sensors/README.md) to start collecting metrics. +collector](/src/collectors/charts.d.plugin/sensors/README.md) to start collecting metrics. -> Netdata uses a few plugins to manage its [collectors](https://github.com/netdata/netdata/blob/master/src/collectors/REFERENCE.md), each using a different language: Go, +> Netdata uses a few plugins to manage its [collectors](/src/collectors/REFERENCE.md), each using a different language: Go, > Python, Node.js, and Bash. While our Go collectors are undergoing the most active development, we still support the > other languages. In this case, you need to enable a temperature sensor collector that's written in Bash. @@ -123,7 +123,7 @@ Raspberry Pi temperature sensor monitoring. ### Storing historical metrics on your Raspberry Pi By default, Netdata allocates 256 MiB in disk space to store h |
