
diff options
| author | Costa Tsaousis <costa@netdata.cloud> | 2022-05-25 01:24:36 +0300 |
|---|---|---|
| committer | GitHub <noreply@github.com> | 2022-05-25 01:24:36 +0300 |
| commit | 38b38b80923f297246f83bbeac9d6c9e2772daff (patch) | |
| tree | 81dbf853658eee097e5cc542a6568b26edd8b611 /collectors | |
| parent | a5c712209281d969c6aba1d456829d24672a566a (diff) | |
add dictionary support to statsd (#12980)
* add dictionary support to statsd
* faster statsd sets and dictionaries; disabled events dimensions by default
* properly detect tags, even without a sampling rate
* statsd assumes a pipe between fields
* missing param
* allow names without values and support more unknown fields
* more parser fixes
* support multiple tags; remove the sum from the dimensions of histograms and timers, but keep it for synthetic charts
* Parse statsd tags and support changing units of private charts
* remove debug code
* added support for naming dimensions too
* updated docs
* added support for family tags
* updated docs
Diffstat (limited to 'collectors')
| -rw-r--r-- | collectors/statsd.plugin/README.md | 185 | ||||
| -rw-r--r-- | collectors/statsd.plugin/statsd.c | 428 |
2 files changed, 459 insertions, 154 deletions
diff --git a/collectors/statsd.plugin/README.md b/collectors/statsd.plugin/README.md index aadd55bd68..7dc5dbb728 100644 --- a/collectors/statsd.plugin/README.md +++ b/collectors/statsd.plugin/README.md @@ -11,17 +11,17 @@ If you want to learn more about the StatsD protocol, we have written a [blog pos Netdata is a fully featured statsd server. It can collect statsd formatted metrics, visualize them on its dashboards and store them in it's database for long-term retention. -Netdata statsd is inside Netdata (an internal plugin, running inside the Netdata daemon), it is configured via `netdata.conf` and by-default listens on standard statsd port 8125. Netdata supports both tcp and udp packets at the same time. +Netdata statsd is inside Netdata (an internal plugin, running inside the Netdata daemon), it is configured via `netdata.conf` and by-default listens on standard statsd port 8125. Netdata supports both TCP and UDP packets at the same time. Since statsd is embedded in Netdata, it means you now have a statsd server embedded on all your servers. -Netdata statsd is fast. It can collect more than **1.200.000 metrics per second** on modern hardware, more than **200Mbps of sustained statsd traffic**, using 1 CPU core. The implementation uses two threads: one thread collects metrics, another one updates the charts from the collected data. +Netdata statsd is fast. It can collect several millions of metrics per second on modern hardware, using just 1 CPU core. The implementation uses two threads: one thread collects metrics, another thread updates the charts from the collected data. -## Available StatsD collectors +## Available StatsD synthetic application charts -Netdata ships with collectors implemented using the StatsD collector. They are configuration files (as you will read below), but they function as a collector, in the sense that configuration file organize the metrics of a data source into pre-defined charts. +Netdata ships with a few synthetic chart definitions to automatically present application metrics into a more uniform way. These synthetic charts are configuration files (you can create your own) that re-arrange statsd metrics into a more meaningful way. -On these charts, we can have alarms as with any metric and chart. +On synthetic charts, we can have alarms as with any metric and chart. - [K6 load testing tool](https://k6.io) - **Description:** k6 is a developer-centric, free and open-source load testing tool built for making performance testing a productive and enjoyable experience. @@ -34,34 +34,36 @@ On these charts, we can have alarms as with any metric and chart. ## Metrics supported by Netdata -Netdata fully supports the StatsD protocol. All StatsD client libraries can be used with Netdata too. +Netdata fully supports the StatsD protocol and also extends it to support more advanced Netdata specific use cases. All StatsD client libraries can be used with Netdata too. -- **Gauges** +- **Gauges** The application sends `name:value|g`, where `value` is any **decimal/fractional** number, StatsD reports the latest value collected and the number of times it was updated (events). The application may increment or decrement a previous value, by setting the first character of the value to `+` or `-` (so, the only way to set a gauge to an absolute negative value, is to first set it to zero). [Sampling rate](#sampling-rates) is supported. + [Tags](#tags) are supported for changing chart units, family and dimension name. When a gauge is not collected and the setting is not to show gaps on the charts (the default), the last value will be shown, until a data collection event changes it. -- **Counters** and **Meters** +- **Counters** and **Meters** The application sends `name:value|c`, `name:value|C` or `name:value|m`, where `value` is a positive or negative **integer** number of events occurred, StatsD reports the **rate** and the number of times it was updated (events). - `:value` can be omitted and StatsD will assume it is `1`. `|c`, `|C` and `|m` can be omitted an StatsD will assume it is `|m`. So, the application may send just `name` and StatsD will parse it as `name:1|m`. + `:value` can be omitted and StatsD will assume it is `1`. `|c`, `|C` and `|m` can be omitted and StatsD will assume it is `|m`. So, the application may send just `name` and StatsD will parse it as `name:1|m`. - Counters use `|c` (etsy/StatsD compatible) or `|C` (brubeck compatible) - Meters use `|m` [Sampling rate](#sampling-rates) is supported. + [Tags](#tags) are supported for changing chart units, family and dimension name. - When a counter or meter is not collected, Netdata **defaults** to showing a zero value, until a data collection event changes the value. + When a counter or meter is not collected, StatsD **defaults** to showing a zero value, until a data collection event changes the value. -- **Timers** and **Histograms** +- **Timers** and **Histograms** - The application sends `name:value|ms` or `name:value|h`, where `value` is any **decimal/fractional** number, StatsD reports **min**, **max**, **average**, **sum**, **95th percentile**, **median** and **standard deviation** and the total number of times it was updated (events). + The application sends `name:value|ms` or `name:value|h`, where `value` is any **decimal/fractional** number, StatsD reports **min**, **max**, **average**, **95th percentile**, **median** and **standard deviation** and the total number of times it was updated (events). Internally it also calculates the **sum**, which is available for synthetic charts. - Timers use `|ms` - Histograms use `|h` @@ -69,38 +71,74 @@ Netdata fully supports the StatsD protocol. All StatsD client libraries can be u The only difference between the two, is the `units` of the charts, as timers report *milliseconds*. [Sampling rate](#sampling-rates) is supported. + [Tags](#tags) are supported for changing chart units and family. - When a counter or meter is not collected, Netdata **defaults** to showing a zero value, until a data collection event changes the value. + When a counter or meter is not collected, StatsD **defaults** to showing a zero value, until a data collection event changes the value. -- **Sets** +- **Sets** The application sends `name:value|s`, where `value` is anything (**number or text**, leading and trailing spaces are removed), StatsD reports the number of unique values sent and the number of times it was updated (events). - Sampling rate is **not** supported for Sets. `value` is always considered text. + Sampling rate is **not** supported for Sets. `value` is always considered text (so `01` and `1` are considered different). - When a counter or meter is not collected, Netdata **defaults** to showing a zero value, until a data collection event changes the value. + [Tags](#tags) are supported for changing chart units and family. + + When a set is not collected, Netdata **defaults** to showing a zero value, until a data collection event changes the value. + +- **Dictionaries** + + The application sends `name:value|d`, where `value` is anything (**number or text**, leading and trailing spaces are removed), StatsD reports the number of events sent for each `value` and the total times `name` was updated (events). + + Sampling rate is **not** supported for Dictionaries. `value` is always considered text (so `01` and `1` are considered different). + + [Tags](#tags) are supported for changing chart units and family. + + When a set is not collected, Netdata **defaults** to showing a zero value, until a data collection event changes the value. #### Sampling Rates The application may append `|@sampling_rate`, where `sampling_rate` is a number from `0.0` to `1.0` in order for StatD to extrapolate the value and predict the total for the entire period. If the application reports to StatsD a value for 1/10th of the time, it can append `|@0.1` to the metrics it sends to statsd. +#### Tags + +The application may append `|#tag1:value1,tag2:value2,tag3:value3` etc, where `tagX` and `valueX` are strings. `:valueX` can be omitted. + +Currently, Netdata uses only 2 tags: + + * `units=string` which sets the units of the chart that is automatically generated + * `family=string` which sets the family of the chart that is automatically generated (the family is the submenu of the dashboard) + * `name=string` which sets the name of the dimension of the chart that is automatically generated (only for counters, meters, gauges) + +Other tags are parsed, but currently are ignored. + +Charts are not updated to change units or dimension names once they are created. So, either send the tags on every event, or use the special `zinit` value to initiaze the charts at the beginning. `zinit` is a special value that can be used on any chart, to have netdata initialize the charts, without actually setting any values to them. So, instead of sending `my.metric:VALUE|c|#units=bytes,name=size` every time, the application can send at the beginning `my.metric:zinit|c|#units=bytes,name=size` and then `my.metric:VALUE|c`. + #### Overlapping metrics -Netdata's StatsD server maintains different indexes for each of the types supported. This means the same metric `name` may exist under different types concurrently. +Netdata's StatsD server maintains different indexes for each of the metric types supported. This means the same metric `name` may exist under different types concurrently. + +#### How to name your metrics + +A good practice is to name your metrics like `application.operation.metric`, where: + +- `application` is the application name - Netdata will automatically create a dashboard section based on the first keyword of the metrics, so you can have all your applications in different sections. +- `operation` is the operation your application is executing, like `dbquery`, `request`, `response`, etc. +- `metric` is anything you want to name your metric as. Netdata will automatically append the metric type (meter, counter, gauge, set, dictionary, timer, histogram) to the generated chart. + +Using [Tags](#tags) you can also change the submenus of the dashboard, the units of the charts and for meters, counters and gauges, the name of dimension. So, you can have a usable default view without using [Synthetic StatsD charts](#synthetic-statsd-charts) #### Multiple metrics per packet -Netdata accepts multiple metrics per packet if each is terminated with `\n`. +Netdata accepts multiple metrics per packet if each is terminated with a newline (`\n`) at the end. #### TCP packets Netdata listens for both TCP and UDP packets. For TCP, is it important to always append `\n` on each metric, as Netdata will use the newline character to detect if a metric is split into multiple TCP packets. -On disconnect, Netdata will process the entire buffer, even if it is not terminated with a `\n`. #### UDP packets -When sending multiple packets over UDP, it is important not to exceed the network MTU, which is usually 1500 bytes. +When sending multiple metrics over a single UDP message, it is important not to exceed the network MTU, which is usually 1500 bytes. Netdata will accept UDP packets up to 9000 bytes, but the underlying network will not exceed MTU. @@ -122,7 +160,7 @@ You can find the configuration at `/etc/netdata/netdata.conf`: # private charts memory mode = save # private charts history = 3996 # histograms and timers percentile (percentThreshold) = 95.00000 - # add dimension for number of events received = yes + # add dimension for number of events received = no # gaps on gauges (deleteGauges) = no # gaps on counters (deleteCounters) = no # gaps on meters (deleteMeters) = no @@ -150,7 +188,7 @@ You can find the configuration at `/etc/netdata/netdata.conf`: - `update every (flushInterval) = 1` seconds, controls the frequency StatsD will push the collected metrics to Netdata charts. -- `decimal detail = 1000` controls the number of fractional digits in gauges and histograms. Netdata collects metrics using signed 64 bit integers and their fractional detail is controlled using multipliers and divisors. This setting is used to multiply all collected values to convert them to integers and is also set as the divisors, so that the final data will be a floating point number with this fractional detail (1000 = X.0 - X.999, 10000 = X.0 - X.9999, etc). +- `decimal detail = 1000` controls the number of fractional digits in gauges and histograms. Netdata collects metrics using signed 64-bit integers and their fractional detail is controlled using multipliers and divisors. This setting is used to multiply all collected values to convert them to integers and is also set as the divisors, so that the final data will be a floating point number with this fractional detail (1000 = X.0 - X.999, 10000 = X.0 - X.9999, etc). The rest of the settings are discussed below. @@ -180,10 +218,9 @@ The default behavior is to use the same settings as the rest of the Netdata Agen ### Optimize private metric charts visualization and storage - If you have thousands of metrics, each with its own private chart, you may notice that your web browser becomes slow when you view the Netdata dashboard (this is a web browser issue we need to address at the Netdata UI). So, Netdata has a protection to stop creating charts when `max private charts allowed = 200` (soft limit) is reached. -The metrics above this soft limit are still processed by Netdata and will be available to be sent to backend time-series databases, up to `max private charts hard limit = 1000`. So, between 200 and 1000 charts, Netdata will still generate charts, but they will automatically be created with `memory mode = none` (Netdata will not maintain a database for them). These metrics will be sent to backend time series databases, if the backend configuration is set to `as collected`. +The metrics above this soft limit are still processed by Netdata, can be used in synthetic charts and will be available to be sent to backend time-series databases, up to `max private charts hard limit = 1000`. So, between 200 and 1000 charts, Netdata will still generate charts, but they will automatically be created with `memory mode = none` (Netdata will not maintain a database for them). These metrics will be sent to backend time series databases, if the backend configuration is set to `as collected`. Metrics above the hard limit are still collected, but they can only be used in synthetic charts (once a metric is added to chart, it will be sent to backend servers too). @@ -240,9 +277,6 @@ This is identical to `counter`. - Format: `name:FLOAT|ms` - StatsD maintains a list of all the values supplied and provides statistics on them. - - -The same chart with the `sum` unselected:  ### Synthetic StatsD charts @@ -369,7 +403,7 @@ Synthetic chart: 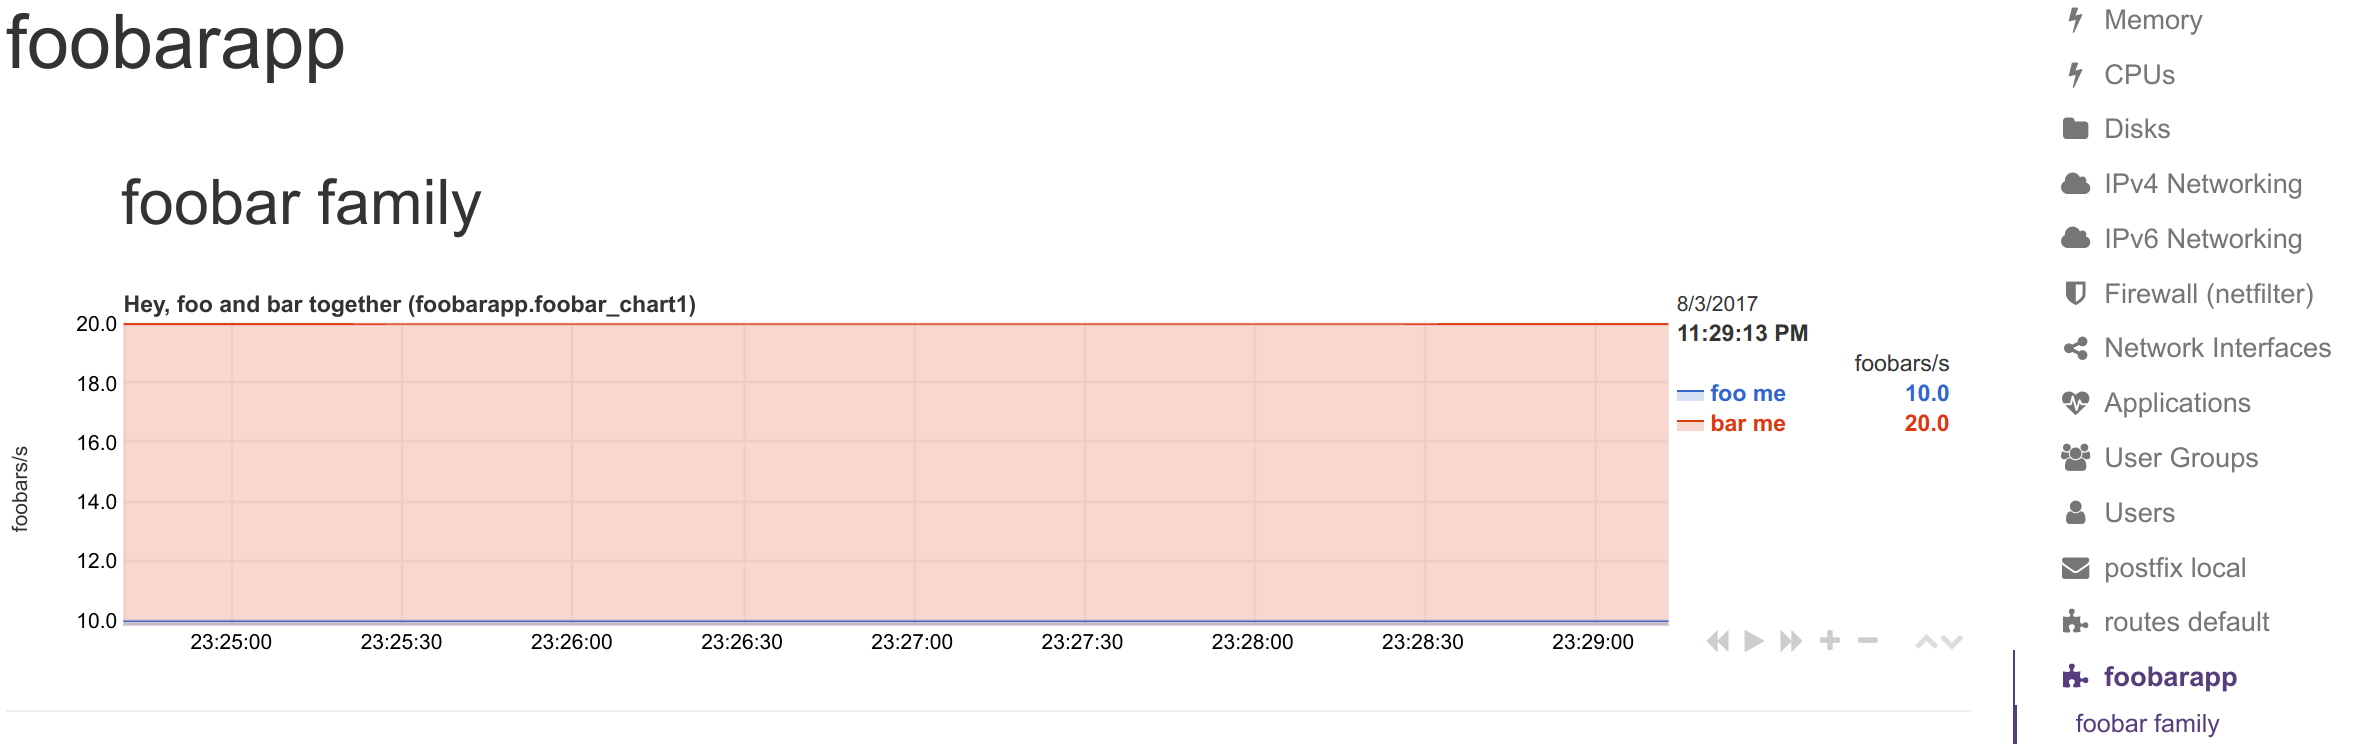 -#### Renaming StatsD metrics +#### Renaming StatsD synthetic charts' metrics You can define a dictionary to rename metrics sent by StatsD clients. This enables you to send response `"200"` and Netdata visualize it as `succesful connection` @@ -438,7 +472,7 @@ You can rename the dimensions with this: Note that we added a `NAME` to the dimension line with `get.`. This is prefixed to the wildcarded part of the metric name, to compose the key for looking up the dictionary. So `500` became `get.500` which was looked up to the dictionary to find value `500 cannot connect to db`. This way we can have different dimension names, for each of the API methods (i.e. `get.500 = 500 cannot connect to db` while `post.500 = 500 cannot write to disk`). -To add all API methods to a chart, you can do this: +To add all 200s across all API methods to a chart, you can do this: ``` [ok_by_method] @@ -539,44 +573,79 @@ You can also use StatsD with: ### Shell -Getting the proper support for a programming language is not always easy, but the Unix shell is available on most Unix systems. You can use shell and `nc` to instrument your systems and send metric data to Netdata's StatsD implementation. Here's how: +Getting the proper support for a programming language is not always easy, but the Unix shell is available on most Unix systems. You can use shell and `nc` to instrument your systems and send metric data to Netdata's StatsD implementation. + +Using the method you can send metrics from any script. You can generate events like: backup.started, backup.ended, backup.time, or even tail logs and convert them to metrics. + +> **IMPORTANT**: +> +> To send StatsD messages you need from the `netcat` package, the `nc` command. +> There are multiple versions of this package. Please try to experiment with the `nc` command you have available on your right system, to find the right parameters. +> +> In the examples below, we assume the `openbsd-netcat` is installed. + +If you plan to send short StatsD events at sporadic occasions, use UDP. The messages should not be too long (remember, most networks support up to 1500 bytes MTU, which is also the limit for StatsD messages over UDP). The good thing is that using UDP will not block your script, even if the StatsD server is not there (UDP messages are "fire-and-forget"). + -The command you need to run is: +For UDP use this: ```sh -echo "NAME:VALUE|TYPE" | nc -u --send-only localhost 8125 +echo "APPLICATION.METRIC:VALUE|TYPE" | nc -u -w 0 localhost 8125 ``` -Where: +`-u` turns on UDP, `-w 0` tells `nc` not to wait for a response from StatsD (idle time to close the connection). -- `NAME` is the metric name -- `VALUE` is the value for that metric (**gauges** `|g`, **timers** `|ms` and **histograms** `|h` accept decimal/fractional numbers, **counters** `|c` and **meters** `|m` accept integers, **sets** `|s` accept anything) -- `TYPE` is one of `g`, `ms`, `h`, `c`, `m`, `s` to select the metric type. +where: -So, to set `metric1` as gauge to value `10`, use: +- `APPLICATION` is any name for your application +- `METRIC` is the name for the specific metric +- `VALUE` is the value for that metric (**meters**, **counters**, **gauges**, **timers** and **histograms** accept integer/decimal/fractional numbers, **sets** and **dictionaries** accept strings) +- `TYPE` is one of `m`, `c`, `g`, `ms`, `h`, `s`, `d` to define the metric type. + +For tailing a log and converting it to metrics, do something like this: ```sh -echo "metric1:10|g" | nc -u --send-only localhost 8125 +tail -f some.log | awk 'awk commands to parse the log and format statsd metrics' | nc -N -w 120 localhost 8125 ``` -To increment `metric2` by `10`, as a counter, use: +`-N` tells `nc` to close the socket once it receives EOF on its input. `-w 120` tells `nc` to stop if the connection is idle for 120 seconds. The timeout is needed to stop the `nc` command if you restart Netdata while `nc` is connected to it. Without it, `nc` will sit idle forever. + +When you embed the above commands to a script, you may notice that all the metrics are sent to StatsD with a delay. They are buffered in the pipes `|`. You can turn them to real-time by prepending each command with `stdbuf -i0 -oL -eL command to be run`, like this: ```sh -echo "metric2:10|c" | nc -u --send-only localhost 8125 +stdbuf -i0 -oL -eL tail -f some.log |\ + stdbuf -i0 -oL -eL awk 'awk commands to parse the log and format statsd metrics' |\ + stdbuf -i0 -oL -eL nc -N -w 120 localhost 8125 +``` + +If you use `mawk` you also need to run awk with `-W interactive`. + +Examples: + +To set `myapp.used_memory` as gauge to value `123456`, use: + +```sh +echo "myapp.used_memory:123456|g|#units:bytes" | nc -u -w 0 localhost 8125 +``` + +To increment `myapp.files_sent` by `10`, as a counter, use: + +```sh +echo "myapp.files_sent:10|c|#units:files" | nc -u -w 0 localhost 8125 ``` You can send multiple metrics like this: ```sh # send multiple metrics via UDP -printf "metric1:10|g\nmetric2:10|c\n" | nc -u --send-only localhost 8125 +printf "myapp.used_memory:123456|g|#units:bytes\nmyapp.files_sent:10|c|#units:files\n" | nc -u -w 0 localhost 8125 ``` Remember, for UDP communication each packet should not exceed the MTU. So, if you plan to push too many metrics at once, prefer TCP communication: ```sh # send multiple metrics via TCP -printf "metric1:10|g\nmetric2:10|c\n" | nc --send-only localhost 8125 +cat /tmp/statsd.metrics.txt | nc -N -w 120 localhost 8125 ``` You can also use this little function to take care of all the details: @@ -584,22 +653,29 @@ You can also use this little function to take care of all the details: ```sh #!/usr/bin/env bash +# we assume nc is from the openbsd-netcat package + STATSD_HOST="localhost" STATSD_PORT="8125" statsd() { - local udp="-u" all="${*}" + local options="-u -w 0" all="${*}" + + # replace all spaces with newlines + all="${all// /\\n}" # if the string length of all parameters given is above 1000, use TCP - [ "${#all}" -gt 1000 ] && udp= + [ "${#all}" -gt 1000 ] && options="-N -w 0" - while [ ! -z "${1}" ] - do - printf "${1}\n" - shift - done | nc ${udp} --send-only ${STATSD_HOST} ${STATSD_PORT} || return 1 + # send the metrics to statsd + printf "${all}\n" | nc ${options} ${STATSD_HOST} ${STATSD_PORT} || return 1 return 0 } + +if [ ! -z "${*}" ] +then + statsd "${@}" +fi ``` You can use it like this: @@ -609,10 +685,15 @@ You can use it like this: source statsd.sh # then, at any point: -StatsD "metric1:10|g" "metric2:10|c" ... +statsd "myapp.used_memory:123456|g|#units:bytes" "myapp.files_sent:10|c|#units:files" ... ``` -The function is smart enough to call `nc` just once and pass all the metrics to it. It will also automatically switch to TCP if the metrics to send are above 1000 bytes. -If you have gotten thus far, make sure to check out our [community forums](https://community.netdata.cloud) to share your experience using Netdata with StatsD. +or even at a terminal prompt, like this: +```sh +./statsd.sh "myapp.used_memory:123456|g|#units:bytes" "myapp.files_sent:10|c|#units:files" ... +``` +The function is smart enough to call `nc` just once and pass all the metrics to it. It will also automatically switch to TCP if the metrics to send are above 1000 bytes. + +If you have gotten thus far, make sure to check out our [community forums](https://community.netdata.cloud) to share your experience using Netdata with StatsD. diff --git a/collectors/statsd.plugin/statsd.c b/collectors/statsd.plugin/statsd.c index fc44f878d8..2c38ddbc2c 100644 --- a/collectors/statsd.plugin/statsd.c +++ b/collectors/statsd.plugin/statsd.c @@ -18,6 +18,10 @@ #error Please increase WORKER_UTILIZATION_MAX_JOB_TYPES to at least 4 #endif +#define STATSD_MAX_UNITS_LENGTH 20 +#define STATSD_MAX_DIMNAME_LENGTH 20 +#define STATSD_MAX_FAMILY_LENGTH 20 + // -------------------------------------------------------------------------------------- // #define STATSD_MULTITHREADED 1 @@ -32,7 +36,7 @@ #define STATSD_FIRST_PTR_MUTEX_INIT .first_mutex = NETDATA_MUTEX_INITIALIZER #define STATSD_FIRST_PTR_MUTEX_LOCK(index) netdata_mutex_lock(&((index)->first_mutex)) #define STATSD_FIRST_PTR_MUTEX_UNLOCK(index) netdata_mutex_unlock(&((index)->first_mutex)) -#define STATSD_DICTIONARY_OPTIONS DICTIONARY_FLAG_DEFAULT +#define STATSD_DICTIONARY_OPTIONS DICTIONARY_FLAG_NONE #else #define STATSD_AVL_TREE avl_tree_type #define STATSD_AVL_INSERT avl_insert @@ -76,7 +80,7 @@ typedef struct statsd_histogram_extensions { RRDDIM *rd_percentile; RRDDIM *rd_median; RRDDIM *rd_stddev; - RRDDIM *rd_sum; + //RRDDIM *rd_sum; size_t size; size_t used; @@ -92,6 +96,23 @@ typedef struct statsd_metric_set { size_t unique; } STATSD_METRIC_SET; +#define STATSD_METRIC_DICTIONARY_FLAGS_DICTFULL_LOGGED 0x000001 + +typedef struct statsd_metric_dictionary_item { + char *name; + size_t count; + RRDDIM *rd; + struct statsd_metric_dictionary_item *next; +} STATSD_METRIC_DICTIONARY_ITEM; + +typedef struct statsd_metric_dictionary { + STATSD_METRIC_DICTIONARY_ITEM *other; + DICTIONARY *dict; + size_t unique; + uint32_t flags; + STATSD_METRIC_DICTIONARY_ITEM *base; +} STATSD_METRIC_DICTIONARY; + // -------------------------------------------------------------------------------------------------------------------- // this is a metric - for all types of metrics @@ -114,7 +135,8 @@ typedef enum statsd_metric_type { STATSD_METRIC_TYPE_METER, STATSD_METRIC_TYPE_TIMER, STATSD_METRIC_TYPE_HISTOGRAM, - STATSD_METRIC_TYPE_SET + STATSD_METRIC_TYPE_SET, + STATSD_METRIC_TYPE_DICTIONARY } STATSD_METRIC_TYPE; @@ -136,8 +158,13 @@ typedef struct statsd_metric { STATSD_METRIC_COUNTER counter; STATSD_METRIC_HISTOGRAM histogram; STATSD_METRIC_SET set; + STATSD_METRIC_DICTIONARY dictionary; }; + char units[STATSD_MAX_UNITS_LENGTH+1]; + char dimname[STATSD_MAX_DIMNAME_LENGTH+1]; + char family[STATSD_MAX_FAMILY_LENGTH+1]; + // chart related members STATS_METRIC_OPTIONS options; // STATSD_METRIC_OPTION_* (bitfield) char reset; // set to 1 by the charting thread to instruct the collector thread(s) to reset this metric @@ -255,6 +282,8 @@ static struct statsd { STATSD_INDEX histograms; STATSD_INDEX meters; STATSD_INDEX sets; + STATSD_INDEX dictionaries; + size_t unknown_types; size_t socket_errors; size_t tcp_socket_connects; @@ -285,6 +314,7 @@ static struct statsd { size_t histogram_increase_step; double histogram_percentile; char *histogram_percentile_str; + size_t dictionary_max_unique; int threads; struct collection_thread_status *collection_threads_status; @@ -352,12 +382,22 @@ static struct statsd { .first = NULL, STATSD_FIRST_PTR_MUTEX_INIT }, + .dictionaries = { + .name = "dictionary", + .events = 0, + .metrics = 0, + .index = STATSD_AVL_INDEX_INIT, + .default_options = STATSD_METRIC_OPTION_NONE, + .first = NULL, + STATSD_FIRST_PTR_MUTEX_INIT + }, .tcp_idle_timeout = 600, .apps = NULL, .histogram_percentile = 95.0, .histogram_increase_step = 10, + .dictionary_max_unique = 200, .threads = 0, .collection_threads_status = NULL, .sockets = { @@ -591,7 +631,7 @@ static inline void statsd_process_set(STATSD_METRIC *m, const char *value) { } if (unlikely(!m->set.dict)) { - m->set.dict = dictionary_create(STATSD_DICTIONARY_OPTIONS | DICTIONARY_FLAG_VALUE_LINK_DONT_CLONE); + m->set.dict = dictionary_create(STATSD_DICTIONARY_OPTIONS | DICTIONARY_FLAG_DONT_OVERWRITE_VALUE); m->set.unique = 0; } @@ -599,9 +639,16 @@ static inline void statsd_process_set(STATSD_METRIC *m, const char *value) { // magic loading of metric, without affecting anything } else { - void *t = dictionary_get(m->set.dict, value); - if (unlikely(!t)) { - dictionary_set(m->set.dict, value, "", 1); + char c = 'N'; // new + char *cptr = (char *)dictionary_set(m->set.dict, value, &c, sizeof(char)); + + // since we pass DICTIONARY_FLAG_DONT_OVERWRITE_VALUE + // the dictionary will return an existing value, if the key is already there + // and based on the returned value, we can know if it is New or Old. + + if(*cptr == 'N') { + // it is a new item + *cptr = 'O'; // mark it as old m->set.unique++; } @@ -610,89 +657,179 @@ static inline void statsd_process_set(STATSD_METRIC *m, const char *value) { } } +static inline void statsd_process_dictionary(STATSD_METRIC *m, const char *value) { + if(!is_metric_useful_for_collection(m)) return; + + if(unlikely(!value || !*value)) { + error("STATSD: metric of type set, with empty value is ignored."); + return; + } + + if(unlikely(m->reset)) + statsd_reset_metric(m); + + if (unlikely(!m->dictionary.dict)) { + m->dictionary.dict = dictionary_create(STATSD_DICTIONARY_OPTIONS | DICTIONARY_FLAG_DONT_OVERWRITE_VALUE); + m->dictionary.unique = 0; + m->dictionary.base = NULL; + } + + if(unlikely(value_is_zinit(value))) { + // magic loading of metric, without affecting anything + } + else { + STATSD_METRIC_DICTIONARY_ITEM *t = (STATSD_METRIC_DICTIONARY_ITEM *)dictionary_get(m->dictionary.dict, value); + + if (unlikely(!t)) { + if(!t && m->dictionary.unique >= statsd.dictionary_max_unique) + value = "other"; + + STATSD_METRIC_DICTIONARY_ITEM tmp = { + .name = NULL, + .count = 0, + .rd = NULL, + .next = NULL + }; + char *name_ptr = NULL; + t = (STATSD_METRIC_DICTIONARY_ITEM *)dictionary_set_with_name_ptr(m->dictionary.dict, value, &tmp, sizeof(STATSD_METRIC_DICTIONARY_ITEM), &name_ptr); + if(!t->name) { + // we just added this + t->name = name_ptr; + t->next = m->dictionary.base; + m->dictionary.base = t; + m->dictionary.unique++; + } + } + + t->count++; + m->events++; + m->count++; + } +} + // -------------------------------------------------------------------------------------------------------------------- // statsd parsing -static void statsd_process_metric(const char *name, const char *value, const char *type, const char *sampling, const char *tags) { - (void)tags; +static inline const char *statsd_parse_skip_up_to(const char *s, char d1, char d2, char d3) { + char c; + + for(c = *s; c && c != d1 && c != d2 && c != d3 && c != '\r' && c != '\n'; c = *++s) ; + + return s; +} + +const char *statsd_parse_skip_spaces(const char *s) { + char c; + + for(c = *s; c && ( c == ' ' || c == '\t' || c == '\r' || c == '\n' ); c = *++s) ; + + return s; +} +static inline const char *statsd_parse_field_trim(const char *start, char *end) { + if(unlikely(!start || !*start)) { + start = end; + return start; + } + + while(start <= end && (*start == ' ' || *start == '\t')) + start++; + + *end = '\0'; + end--; + while(end >= start && (*end == ' ' || *end == '\t')) + *end-- = '\0'; + + return start; +} + +static void statsd_process_metric(const char *name, const char *value, const char *type, const char *sampling, const char *tags) { debug(D_STATSD, "STATSD: raw metric '%s', value '%s', type '%s', sampling '%s', tags '%s'", name?name:"(null)", value?value:"(null)", type?type:"(null)", sampling?sampling:"(null)", tags?tags:"(null)"); if(unlikely(!name || !*name)) return; if(unlikely(!type || !*type)) type = "m"; - char t0 = type[0], t1 = type[1]; + STATSD_METRIC *m = NULL; + char t0 = type[0], t1 = type[1]; if(unlikely(t0 == 'g' && t1 == '\0')) { statsd_process_gauge( - statsd_find_or_add_metric(&statsd.gauges, name, STATSD_METRIC_TYPE_GAUGE), - value, sampling); + m = statsd_find_or_add_metric(&statsd.gauges, name, STATSD_METRIC_TYPE_GAUGE), + value, sampling); } else if(unlikely((t0 == 'c' || t0 == 'C') && t1 == '\0')) { // etsy/statsd uses 'c' // brubeck uses 'C' statsd_process_counter( - statsd_find_or_add_metric(&statsd.counters, name, STATSD_METRIC_TYPE_COUNTER), - value, sampling); + m = statsd_find_or_add_metric(&statsd.counters, name, STATSD_METRIC_TYPE_COUNTER), + value, sampling); } else if(unlikely(t0 == 'm' && t1 == '\0')) { statsd_process_meter( - statsd_find_or_add_metric(&statsd.meters, name, STATSD_METRIC_TYPE_METER), - value, sampling); + m = statsd_find_or_add_metric(&statsd.meters, name, STATSD_METRIC_TYPE_METER), + value, sampling); } else if(unlikely(t0 == 'h' && t1 == '\0')) { statsd_process_histogram( - statsd_find_or_add_metric(&statsd.histograms, name, STATSD_METRIC_TYPE_HISTOGRAM), - value, sampling); + m = statsd_find_or_add_metric(&statsd.histograms, name, STATSD_METRIC_TYPE_HISTOGRAM), + value, sampling); } else if(unlikely(t0 == 's' && t1 == '\0')) { statsd_process_set( - statsd_find_or_add_metric(&statsd.sets, name, STATSD_METRIC_TYPE_SET), - value); + m = statsd_find_or_add_metric(&statsd.sets, name, STATSD_METRIC_TYPE_SET), + value); + } + else if(unlikely(t0 == 'd' && t1 == '\0')) { + statsd_process_dictionary( + m = statsd_find_or_add_metric(&statsd.dictionaries, name, STATSD_METRIC_TYPE_DICTIONARY), + value); } else if(unlikely(t0 == 'm' && t1 == 's' && type[2] == '\0')) { statsd_process_timer( - statsd_find_or_add_metric(&statsd.timers, name, STATSD_METRIC_TYPE_TIMER), - value, sampling); + m = statsd_find_or_add_metric(&statsd.timers, name, STATSD_METRIC_TYPE_TIMER), + value, sampling); } else { statsd.unknown_types++; error("STATSD: metric '%s' with value '%s' is sent with unknown metric type '%s'", name, value?value:"", type); } -} -static inline const char *statsd_parse_skip_up_to(const char *s, char d1, char d2) { - char c; + if(m && tags && *tags) { + const char *s = tags; + while(*s) { + const char *tagkey = NULL, *tagvalue = NULL; + char *tagkey_end = NULL, *tagvalue_end = NULL; - for(c = *s; c && c != d1 && c != d2 && c != '\r' && c != '\n'; c = *++s) ; - - return s; -} + s = tagkey_end = (char *)statsd_parse_skip_up_to(tagkey = s, ':', '=', ','); + if(tagkey == tagkey_end) { + if (*s) { + s++; + s = statsd_parse_skip_spaces(s); + } + continue; + } -const char *statsd_parse_skip_spaces(const char *s) { - char c; + if(likely(*s == ':' || *s == '=')) + s = tagvalue_end = (char *) statsd_parse_skip_up_to(tagvalue = ++s, ',', '\0', '\0'); - for(c = *s; c && ( c == ' ' || c == '\t' || c == '\r' || c == '\n' ); c = *++s) ; + if(*s == ',') s++; - return s; -} + statsd_parse_field_trim(tagkey, tagkey_end); + statsd_parse_field_trim(tagvalue, tagvalue_end); -static inline const char *statsd_parse_field_trim(const char *start, char *end) { - if(unlikely(!start)) { - start = end; - return start; - } + if(tagkey && tagkey && tagvalue && *tagvalue) { + if (!m->units[0] && strcmp(tagkey, "units") == 0) + strncpyz(m->units, tagvalue, STATSD_MAX_UNITS_LENGTH); - while(start <= end && (*start == ' ' || *start == '\t')) - start++; + if (!m->dimname[0] && strcmp(tagkey, "name") == 0) + strncpyz(m->dimname, tagvalue, STATSD_MAX_DIMNAME_LENGTH); - *end = '\0'; - end--; - while(end >= start && (*end == ' ' || *end == '\t')) - *end-- = '\0'; - - return start; + if (!m->family[0] && strcmp(tagkey, "family") == 0) + strncpyz(m->family, tagvalue, STATSD_MAX_FAMILY_LENGTH); + } + } + } } static inline size_t statsd_process(char *buffer, size_t size, int require_newlines) { @@ -704,7 +841,7 @@ static inline size_t statsd_process(char *buffer, size_t size, int require_newli const char *name = NULL, *value = NULL, *type = NULL, *sampling = NULL, *tags = NULL; char *name_end = NULL, *value_end = NULL, *type_end = NULL, *sampling_end = NULL, *tags_end = NULL; - s = name_end = (char *)statsd_parse_skip_up_to(name = s, ':', '|'); + s = name_end = (char *)statsd_parse_skip_up_to(name = s, ':', '=', '|'); if(name == name_end) { if (*s) { s++; @@ -713,20 +850,27 @@ static inline size_t statsd_process(char *buffer, size_t size, int require_newli continue; } - if(likely(*s == ': |