
diff options
| author | Costa Tsaousis <costa@tsaousis.gr> | 2018-11-12 04:56:44 +0200 |
|---|---|---|
| committer | GitHub <noreply@github.com> | 2018-11-12 04:56:44 +0200 |
| commit | 10a919ccfa4a1c471ddc38d93f8ac057942db9ea (patch) | |
| tree | 65d7aeb9c3047ea807908003a61b5e8c24842e74 /README.md | |
| parent | 484fe607d103a0aa5e0d230ed80f15a5d1796702 (diff) | |
Another Readme Update (#4612)
* updated readme
* updated readme
* updated readme
* updated readme
* updated readme
* updated readme
* updated readme
* updated readme
* updated readme
* updated readme
* updated readme
* updated readme
* updated readme
* updated readme
* updated readme
* updated readme
* updated readme
* updated readme
* updated readme
* updated readme
* updated readme
* updated readme
* updated readme
Diffstat (limited to 'README.md')
| -rw-r--r-- | README.md | 150 |
1 files changed, 50 insertions, 100 deletions
@@ -4,14 +4,19 @@ --- -**Netdata** is a system for **distributed real-time performance and health monitoring**. - -It provides **unparalleled insights**, **in real-time**, of everything happening on the systems it runs (including containers and applications such as web and database servers), using **modern interactive web dashboards**. +**Netdata** is **distributed, real-time, performance and health monitoring for systems and applications**. It is based on a powerful monitoring agent you install on all your systems and containers. + +Netdata provides **unparalleled insights**, **in real-time**, of everything happening on the systems it runs (including web servers, databases, applications), using **highly interactive web dashboards**. It can run autonomously, without any third party components, or it can be integrated to existing monitoring toolchains (Prometheus, Graphite, OpenTSDB, Kafka, Grafana, etc). _Netdata is **fast** and **efficient**, designed to permanently run on all systems (**physical** & **virtual** servers, **containers**, **IoT** devices), without disrupting their core function._ - + Netdata is **free, open-source software** and it currently runs on **Linux**, **FreeBSD**, and **MacOS**. + + +Netdata is in the [Cloud Native Computing Foundation (CNCF) landscape](https://landscape.cncf.io/grouping=no&sort=stars). +Check the [CNCF TOC Netdata presentation](https://docs.google.com/presentation/d/18C8bCTbtgKDWqPa57GXIjB2PbjjpjsUNkLtZEz6YK8s/edit?usp=sharing). + --- People get **addicted to netdata**.<br/> @@ -21,6 +26,7 @@ Once you use it on your systems, **there is no going back**! *You have been warn [](https://twitter.com/intent/tweet?text=Netdata,%20real-time%20performance%20and%20health%20monitoring,%20done%20right!&url=https://my-netdata.io/&via=linuxnetdata&hashtags=netdata,monitoring) + ## Contents 1. [How it looks](#how-it-looks) - have a quick look at it @@ -28,13 +34,14 @@ Once you use it on your systems, **there is no going back**! *You have been warn 3. [Quick Start](#quick-start) - try it now on your systems 4. [Why Netdata](#why-netdata) - why people love netdata, how it compares with other solutions 5. [News](#news) - latest news about netdata -6. [infographic](#infographic) - everything about netdata, in a page -7. [Features](#features) - what features does it have -8. [Visualization](#visualization) - unique visualization features -9. [What does it monitor](#what-does-it-monitor) - which metrics it collects -10. [Documentation](#documentation) - read the docs -11. [Community](#community) - disucss with others and get support -12. [License](#license) - check the license of netdata +6. [How it works](#how-it-works) - high level diagram of how netdata works +7. [infographic](#infographic) - everything about netdata, in a page +8. [Features](#features) - what features does it have +9. [Visualization](#visualization) - unique visualization features +10. [What does it monitor](#what-does-it-monitor) - which metrics it collects +11. [Documentation](#documentation) - read the docs +12. [Community](#community) - disucss with others and get support +13. [License](#license) - check the license of netdata ## How it looks @@ -45,27 +52,26 @@ The following animated image, shows the top part of a typical netdata dashboard. *A typical netdata dashboard, in 1:1 timing. Charts can be panned by dragging them, zoomed in/out with `SHIFT` + `mouse wheel`, an area can be selected for zoom-in with `SHIFT` + `mouse selection`. Netdata is highly interactive and **real-time**, optimized to get the work done!* -> *We have a few online demos to check: [http://my-netdata.io](http://my-netdata.io)* +> *We have a few online demos to see it in action: [http://my-netdata.io](http://my-netdata.io)* ## User base - - -Netdata is in the [Cloud Native Computing Foundation (CNCF) landscape](https://landscape.cncf.io/grouping=no&sort=stars). -Check the [CNCF TOC Netdata presentation](https://docs.google.com/presentation/d/18C8bCTbtgKDWqPa57GXIjB2PbjjpjsUNkLtZEz6YK8s/edit?usp=sharing). - -Netdata is a **robust** application. It has hundreds of thousands of users, all over the world. +Netdata is used by hundreds of thousands of users all over the world. Check our [GitHub watchers list](https://github.com/netdata/netdata/watchers). -You will find users working for: **Amazon**, **Atos**, **Baidu**, **Cisco Systems**, **Citrix**, **Deutsche Telekom**, **DigitalOcean**, +You will find people working for **Amazon**, **Atos**, **Baidu**, **Cisco Systems**, **Citrix**, **Deutsche Telekom**, **DigitalOcean**, **Elastic**, **EPAM Systems**, **Ericsson**, **Google**, **Groupon**, **Hortonworks**, **HP**, **Huawei**, **IBM**, **Microsoft**, **NewRelic**, **Nvidia**, **Red Hat**, **SAP**, **Selectel**, **TicketMaster**, **Vimeo**, and many more! -#### Docker pulls -Docker pulls as reported by docker hub:<br/>[](https://hub.docker.com/r/netdata/netdata/) [](https://hub.docker.com/r/firehol/netdata/) [](https://hub.docker.com/r/titpetric/netdata/) +### Docker pulls +We provide docker images for the most common architectures. These are statistics reported by docker hub: -#### Anonymous global public netdata registry -*Since May 16th 2016 (the date the [global public netdata registry](https://github.com/netdata/netdata/wiki/mynetdata-menu-item) was released):*<br/>[](https://registry.my-netdata.io/#menu_netdata_submenu_registry) [](https://registry.my-netdata.io/#menu_netdata_submenu_registry) [](https://registry.my-netdata.io/#menu_netdata_submenu_registry) +[](https://hub.docker.com/r/netdata/netdata/) [](https://hub.docker.com/r/firehol/netdata/) [](https://hub.docker.com/r/titpetric/netdata/) + +### Registry +When you install multiple netdata, they are integrated into **one distributed application**, via a [netdata registry](https://github.com/netdata/netdata/wiki/mynetdata-menu-item). This is a web browser feature and it allows us to count the number of unique users and unique netdata servers installed. The following information comes from the global public netdata registry we run: + +[](https://registry.my-netdata.io/#menu_netdata_submenu_registry) [](https://registry.my-netdata.io/#menu_netdata_submenu_registry) [](https://registry.my-netdata.io/#menu_netdata_submenu_registry) *in the last 24 hours:*<br/> [](https://registry.my-netdata.io/#menu_netdata_submenu_registry) [](https://registry.my-netdata.io/#menu_netdata_submenu_registry) [](https://registry.my-netdata.io/#menu_netdata_submenu_registry) @@ -124,80 +130,6 @@ Netdata is **open-source**, **free**, super **fast**, very **easy**, completely It has been designed by **SysAdmins**, **DevOps** and **Developers** for troubleshooting performance problems, not just visualize metrics. -### Simplicity - -> Most monitoring solutions require endless configuration of whatever imaginable. - -Well... this is a linux box. Why do we need to configure every single metric we need to monitor. -Of course it has a CPU and RAM and a few disks, and ethernet ports, it may run a firewall, a web server, or a database server and so on. -Why do we need to configure all these metrics? - -Netdata metrics collection is designed to support **configuration-less** operation. So, you just install and run netdata. -You will need to configure something only if it cannot be auto-detected. - -Of course you can enable, tweak or disable things. -But by default, if netdata can connect to a web server you run on your systems, it will automatically -collect all performance metrics. This happens for all data collection plugins when technically possible. -It will also automatically collect all available system values for CPU, memory, disks, network interfaces, -QoS (with labels if you also use [FireQOS](http://firehol.org/)), etc. -Even for processes that do not offer performance metrics, it will automatically group the whole process -tree and provide metrics like CPU usage, memory allocated, opened files, sockets, disk activity, swap -activity, etc per application group. - -### Performance monitoring - -According to reports, performance issues are 10x more common compared to outages. - -> Take any performance monitoring solution and try to troubleshoot a performance problem. -> At the end of the day you will have to `ssh` to the server(s) to understand what exactly is happening. -> You will have to use `iostat`, `iotop`, `vmstat`, `top`, `ethtool` and probably a few dozen more console tools to figure -> out the problem. - -With netdata, this need is eliminated significantly. Of course you will ssh. Just not for monitoring performance. - -One key parameter to effectively troubleshoot performance issues, is that the root cause is most probably unknown. -If you were aware of the element that affected performance, most probably you would have fixed it already. - -The approach of most monitoring solutions (including commercial SaaS providers) that instruct their users and customers -to collect only the metrics they understand, is contradictory to the nature of performance monitoring. If we knew the metrics -before hand, most probably we would have a lot less performance issues. - -So, Netdata collects everything. The more metrics collected, the more insights we will have when we need them. - -Netdata is better than most console tools. Netdata visualizes the data, while the console tools just show their values. -The detail is the same. Actually, netdata is more precise than most console tools, -it will interpolate all collected values to second boundary, so that even if something took a few microseconds more to be -collected, netdata will correctly estimate the per second rate. - -### Realtime monitoring - -> Any performance monitoring solution that does not go down to per second collection and visualization of the data, -> is useless. It will make you happy to have it, but it will not help you more than that. - -Visualizing the present in **real-time and in great detail**, is the most important value a performance monitoring -solution should provide. The next most important is the last hour, again per second. The next is the last 8 hours -and so on, up to a week. In my 20+ years in IT, I needed just once or twice to look a year back. And this was mainly -out of curiosity. - -Of course, real-time monitoring requires resources. So netdata is extremely optimized to be very efficient: - -- collecting performance data is a repeating process - you do the same thing again and again. - Netdata has been designed to learn from each iteration, so that the next one will be faster. - It learns the sizes of files (it even keeps them open when it can), the number of lines and - words per line they contain, the sizes of the buffers it needs to process them, etc. - It adapts, so that everything will be as ready as possible for the next iteration. - -- internally, it uses hashes and indexes (b-trees), to speed up lookups of metrics, charts, dimensions, settings. - -- it has an in-memory round robin database based on a custom floating point number that allows it to pack values - and flags together, in 32 bits, to lower its memory footprint. - -- its internal web server is capable of generating JSON responses from live performance data with speeds comparable - to static content delivery (it does not use printf, it is actually 11 times faster than in generating JSON compared - to printf). - -Netdata will use some CPU and memory, but it will not produce any disk I/O at all, apart its logs (which you can disable if you like). - ## News @@ -223,7 +155,25 @@ Netdata used to be a [firehol.org](https://firehol.org) project, accessible as ` Netdata now has its own github organization `netdata`, so all github URLs are now `netdata/netdata`. The old github URLs, repo clones, forks, etc redirect automatically to the new repo. - +## How it works + +Netdata is a highly efficient, highly modular, metrics management engine. Its lockless design makes it ideal for concurrent operations on the metrics. + +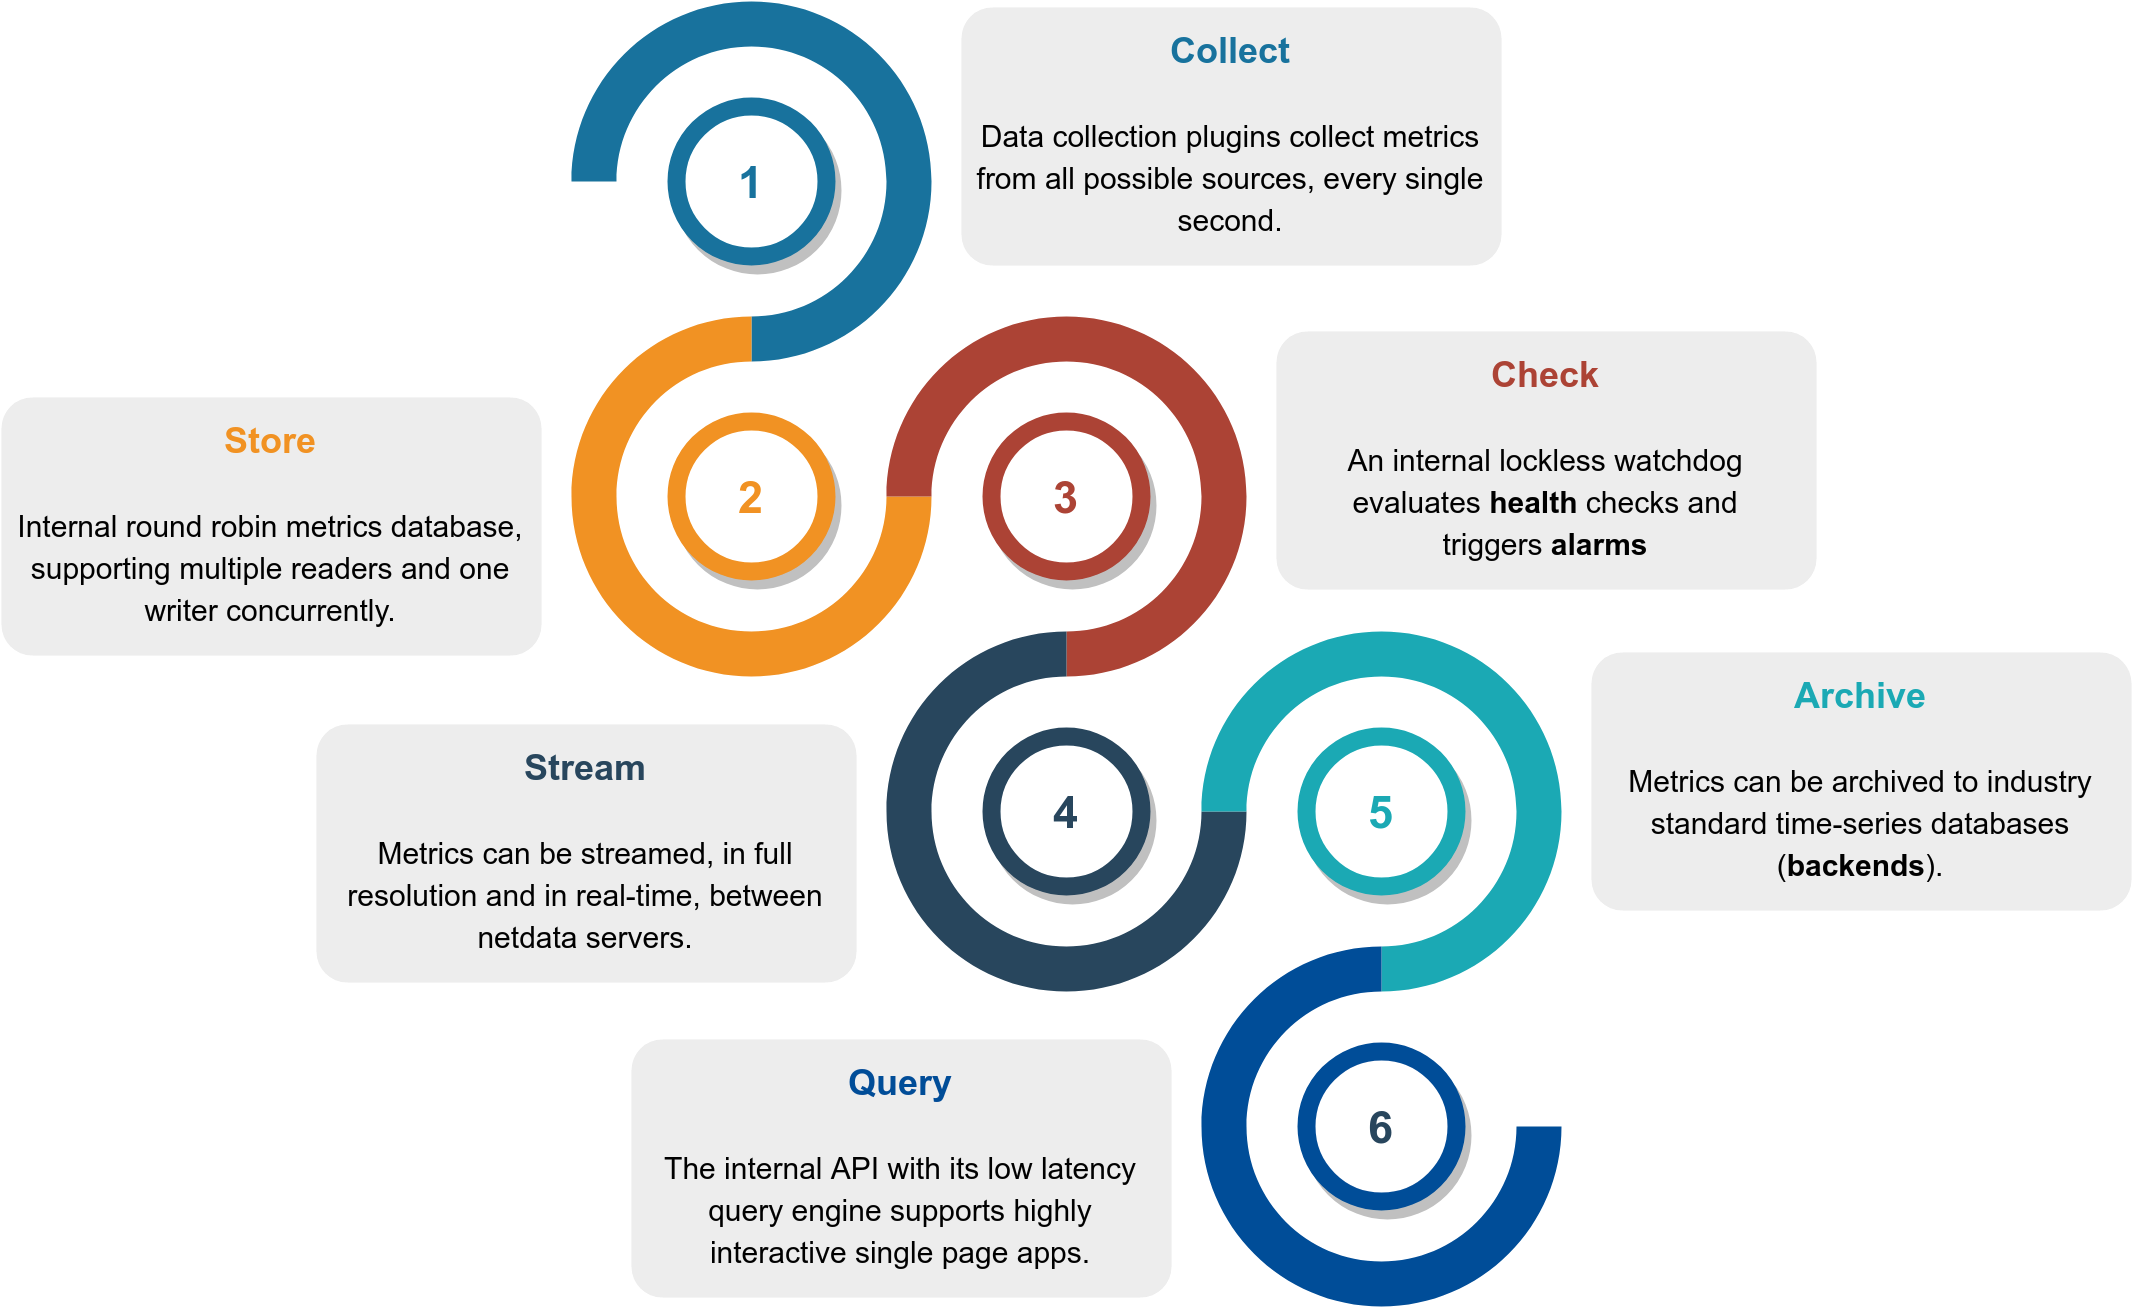 + +This is how it works: + +Function|Description|Documentation +:---:|:---|:---: +**Collect**|Multiple independent data collection workers are collecting metrics from their sources using the optimal protocol for each application and push the metrics to the database. Each data collection worker has lockless write access to the metrics it collects.|[Collectors](https://github.com/netdata/netdata/tree/master/collectors#data-collection-plugins) +**Store**|Metrics are stored in RAM in a round robin database (ring buffer), using a custom made floating point number for minimal footprint.|[Database](https://github.com/netdata/netdata/tree/master/database#netdata-database) +**Check**|A lockless independent watchdog is evaluating **health checks** on the collected metrics, triggers alarms, maintains a health transaction log and dispatches alarm notifications.|[Health](https://github.com/netdata/netdata/tree/master/health#health-monitoring) +**Stream**|An lockless independent worker is streaming metrics, in full detail and in real-time, to remote netdata servers, as soon as they are collected.|[Streaming](https://github.com/netdata/netdata/tree/master/streaming#metrics-streaming) +**Archieve**|A lockless independent worker is down-sampling the metrics and pushes them to **backend** time-series databases.|[Backends](https://github.com/netdata/netdata/tree/master/backends) +**Query**|Multiple independent workers are attached to the [internal web server](https://github.com/netdata/netdata/tree/master/web/server#netdata-web-server), servicing API requests, including [data queries](https://github.com/netdata/netdata/tree/master/web/api/queries#database-queries).|[API](https://github.com/netdata/netdata/tree/master/web/api#api) + +The result is a highly efficient, low latency system, supporting multiple readers and one writer on each metric. + ## Infographic This is a high level overview of netdata feature set and architecture. @@ -274,7 +224,7 @@ To improve clarity on charts, netdata dashboards present **positive** values for *Netdata charts showing the bandwidth and packets of a network interface. `received` is positive and `sent` is negative.* -### Non zero-based y-axis +### Autoscaled y-axis Netdata charts automatically zoom vertically, to visualize the variation of each metric within the visible time-frame. @@ -372,7 +322,6 @@ Its [Plugin API](collectors/plugins.d) supports all programing languages (anythi - **AP** - collects Linux access point performance data (`hostapd`). - **SNMP** - SNMP devices can be monitored too (although you will need to configure these). - **port_check** - checks TCP ports for availability and response time. -- **IPVS** - collects metrics from the Linux IPVS load balancer. - **LibreSwan** - collects metrics per IPSEC tunnel. #### Processes @@ -404,6 +353,7 @@ Its [Plugin API](collectors/plugins.d) supports all programing languages (anythi - **Squid** - multiple servers, each showing: clients bandwidth and requests, servers bandwidth and requests. - **Traefik** - connects to multiple traefik instances (local or remote) to collect API metrics (response status code, response time, average response time and server uptime). - **Varnish** - threads, sessions, hits, objects, backends, etc. +- **IPVS** - collects metrics from the Linux IPVS load balancer. #### Database Servers - **CouchDB** - reads/writes, request methods, status codes, tasks, replication, per-db, etc. |