
diff options
| author | Costa Tsaousis <costa@netdata.cloud> | 2024-02-06 18:01:30 +0200 |
|---|---|---|
| committer | GitHub <noreply@github.com> | 2024-02-06 18:01:30 +0200 |
| commit | a7b0ee58beb76fc76b8c23900091b4283f2046ef (patch) | |
| tree | 05fa96287e04ea45bb79b7584e3f1a87cce1a9a0 /README.md | |
| parent | 9dec08180ce639ec3f8ef1ddeefbfa03509002b3 (diff) | |
Update README.md
Diffstat (limited to 'README.md')
| -rw-r--r-- | README.md | 18 |
1 files changed, 12 insertions, 6 deletions
@@ -63,6 +63,18 @@ It scales nicely from just a single server to thousands of servers, even in comp Netdata is a modular platform that can be extended in all possible ways and it also integrates nicely with other monitoring solutions. --- + +### :boom: NEW: Network Connections Explorer :boom: +Network Connections viewer is currently in the nightly builds of Netdata! + +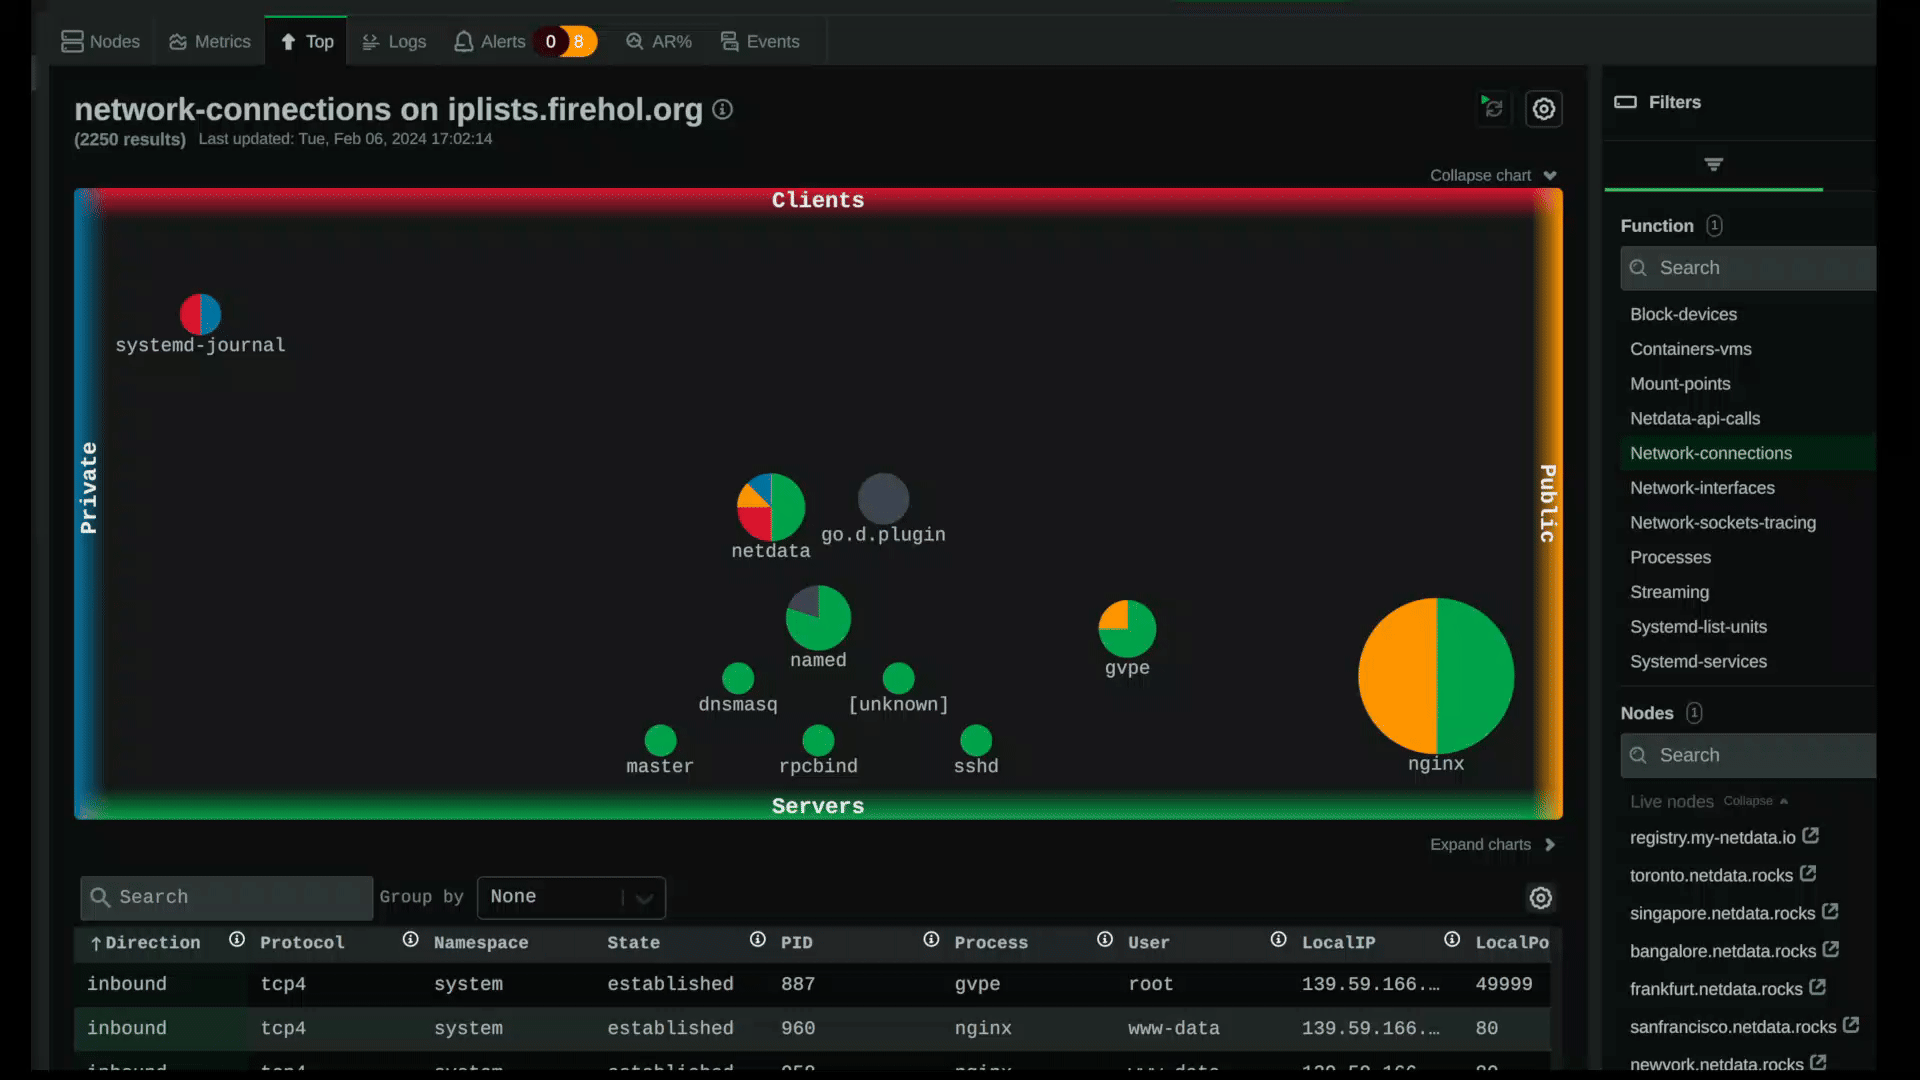 + +This tool visualizes all the sockets each server has (IPv4 and IPv6, TCP and UDP). It can classify them as `inbound`, `outbound`, `listen` and `local` and allow filtering on them. The visualization has 4 sides: `public` (meaning public IPs), `private` (meaning private and reserved IPs), `servers` (meaning listening and inbound sockets), `clients` (meaning sockets towards other servers). The position of each application on the chart is determined by the classification of the sockets it uses (so to the top as clients, to the bottom are servers, to the right are internet facing, to the left is private facing). The size of each app in the chart is determined by the number of sockets it has. Each chart is a pie chart showing the percentage of each kind of sockets each app has. + +--- + +### :star: **Netdata is the most energy-efficient monitoring tool for Docker-based systems** :star: + <p align="center"> <a href="https://www.ivanomalavolta.com/files/papers/ICSOC_2023.pdf#gh-dark-mode-only"> <img src="https://github.com/netdata/netdata/assets/139226121/7118757a-38fb-48d7-b12a-53e709a8e8c0" alt="Energy Efficiency" width="1000"/> @@ -72,17 +84,11 @@ It scales nicely from just a single server to thousands of servers, even in comp </a> </p> -:star: **Netdata is the most energy-efficient monitoring tool for Docker-based systems** :star: <br/> - Dec 11, 2023: [University of Amsterdam published a study](https://twitter.com/IMalavolta/status/1734208439096676680) related to the impact of monitoring tools for Docker based systems, aiming to answer 2 questions: 1. **What is the impact of monitoring tools on the energy efficiency of Docker-based systems?** 2. **What is the impact of monitoring tools on the performance of Docker-based systems?** -They tested ELK, Prometheus, Netdata and Zipkin, under 9 different configurations (Low, Mid, High Frequency vs. Low, Mid, High Workload, 3x3). - -This is how Netdata stands: - - 🚀 Netdata excels in energy efficiency: **"... Netdata being the most energy-efficient tool ..."**, as the study says. - 🚀 Netdata excels in CPU Usage, RAM Usage and Execution Time, and has a similar impact in Network Traffic as Prometheus. |