diff options
| author | Joel Hans <joel@netdata.cloud> | 2020-05-14 06:50:01 -0700 |
|---|---|---|
| committer | GitHub <noreply@github.com> | 2020-05-14 06:50:01 -0700 |
| commit | 9d712b513566f1f90f6031f16c25953c5d836891 (patch) | |
| tree | 9aa1340a8b3529271941ce7cb809bbc65c42453a /README.md | |
| parent | 4609d5b3dd1ad4d26daae52aaa5bda1948be288e (diff) | |
Docs: Remove old Cloud/dashboard and replace with new Cloud/dashboard (#8874)
* Add options to daemon, clean up claiming
* Caught one more old conf
* Remove cloud docs
* I did a lot of things
* Rewrite tutorial step 3
* Remove my nodes menu, sync what-is-netdata
* Restore ACLK/claim/daemon docs to be handled by docs-go-live
* Fix up what-is-netdata
* More cleanup of README/what-is-netdata
* Restore daemon/config/README.md
* Fix frontmatter
* Change title, fix broken link
* Copyediting fixes
* Remove symbols
* Add a few more GIFs
* Fix hash
* Fix other hash
* Fix wording in web gui
* Address Andrew's and Jacek's comments
Diffstat (limited to 'README.md')
| -rw-r--r-- | README.md | 28 |
1 files changed, 13 insertions, 15 deletions
@@ -1,7 +1,7 @@ <!-- --- title: "Netdata" -date: 2020-04-06 +date: 2020-05-01 custom_edit_url: https://github.com/netdata/netdata/edit/master/README.md --- --> @@ -72,7 +72,7 @@ Netdata!](https://img.shields.io/twitter/url/http/shields.io.svg?style=social&la The following animated GIF shows the top part of a typical Netdata dashboard. 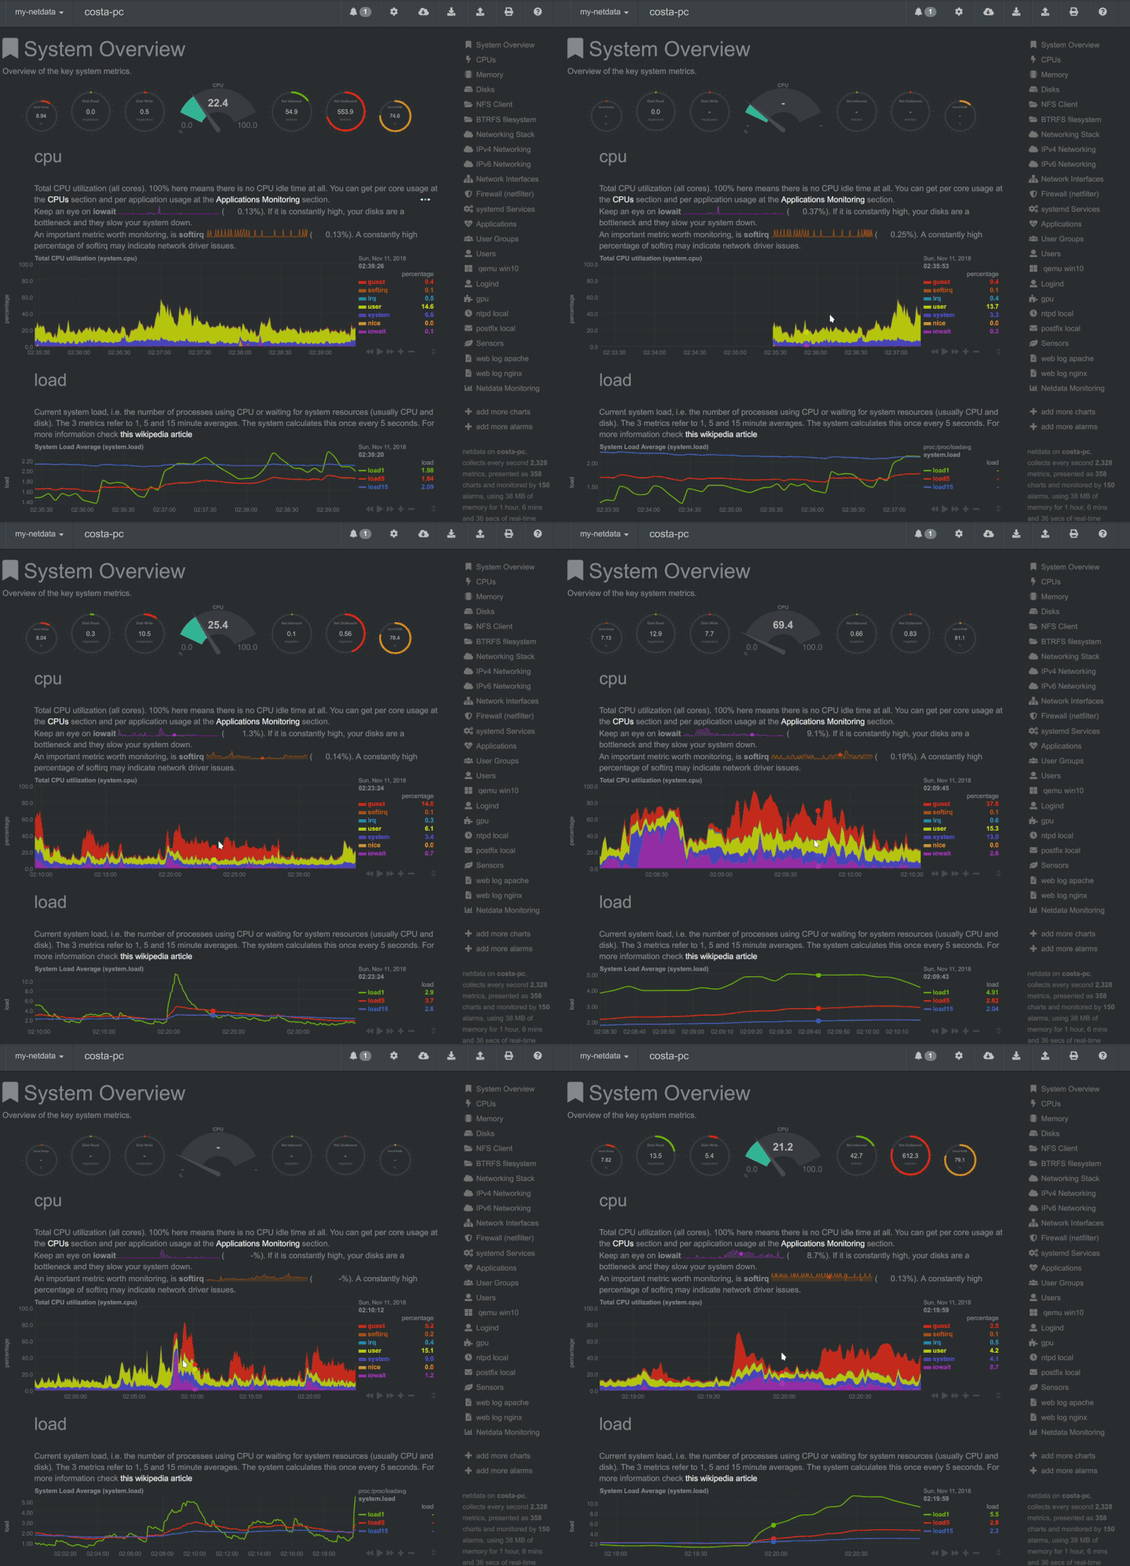 +action](https://user-images.githubusercontent.com/1153921/80827388-b9fee100-8b98-11ea-8f60-0d7824667cd3.gif) > A typical Netdata dashboard, in 1:1 timing. Charts can be panned by dragging them, zoomed in/out with `SHIFT` + `mouse > wheel`, an area can be selected for zoom-in with `SHIFT` + `mouse selection`. Netdata is highly interactive, @@ -175,7 +175,7 @@ For more information about running Netdata in Docker, check the [docker installa From Netdata v1.12 and above, anonymous usage information is collected by default and sent to Google Analytics. To read more about the information collected and how to opt-out, check the [anonymous statistics -page](docs/anonymous-statistics.md). +page](/docs/anonymous-statistics.md). ## Why Netdata @@ -304,8 +304,8 @@ This is what you should expect from Netdata: [flock.com](/health/notifications/flock/), [hangouts](/health/notifications/hangouts/), [irc](/health/notifications/irc/), [kavenegar.com](/health/notifications/kavenegar/), [messagebird.com](/health/notifications/messagebird/), [pagerduty.com](/health/notifications/pagerduty/), - [prowl](health/notifications/prowl/), [pushbullet.com](/health/notifications/pushbullet/), - [pushover.net](health/notifications/pushover/), [rocket.chat](/health/notifications/rocketchat/), + [prowl](/health/notifications/prowl/), [pushbullet.com](/health/notifications/pushbullet/), + [pushover.net](/health/notifications/pushover/), [rocket.chat](/health/notifications/rocketchat/), [slack.com](/health/notifications/slack/), [smstools3](/health/notifications/smstools3/), [syslog](/health/notifications/syslog/), [telegram.org](/health/notifications/telegram/), [twilio.com](/health/notifications/twilio/), [web](/health/notifications/web/) and [custom @@ -337,7 +337,8 @@ This is what you should expect from Netdata: To improve clarity on charts, Netdata dashboards present **positive** values for metrics representing `read`, `input`, `inbound`, `received` and **negative** values for metrics representing `write`, `output`, `outbound`, `sent`. -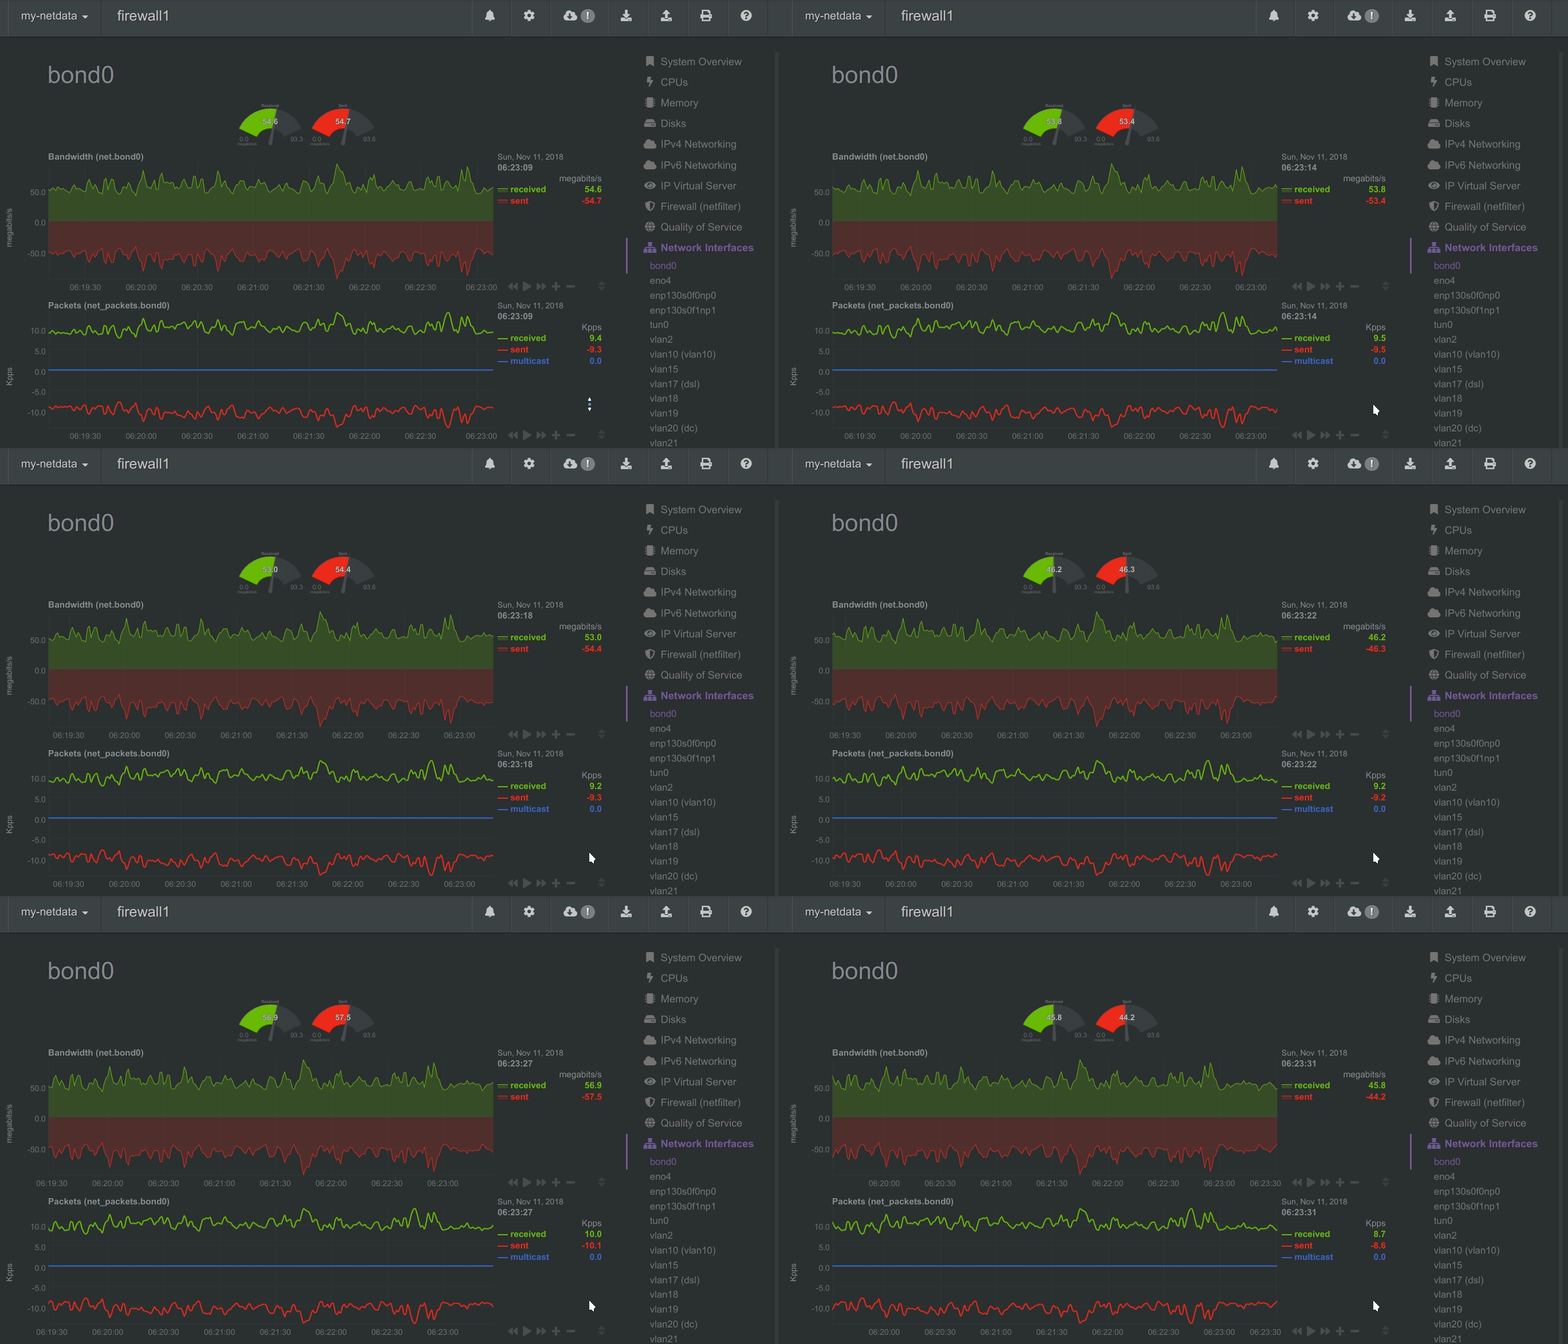 +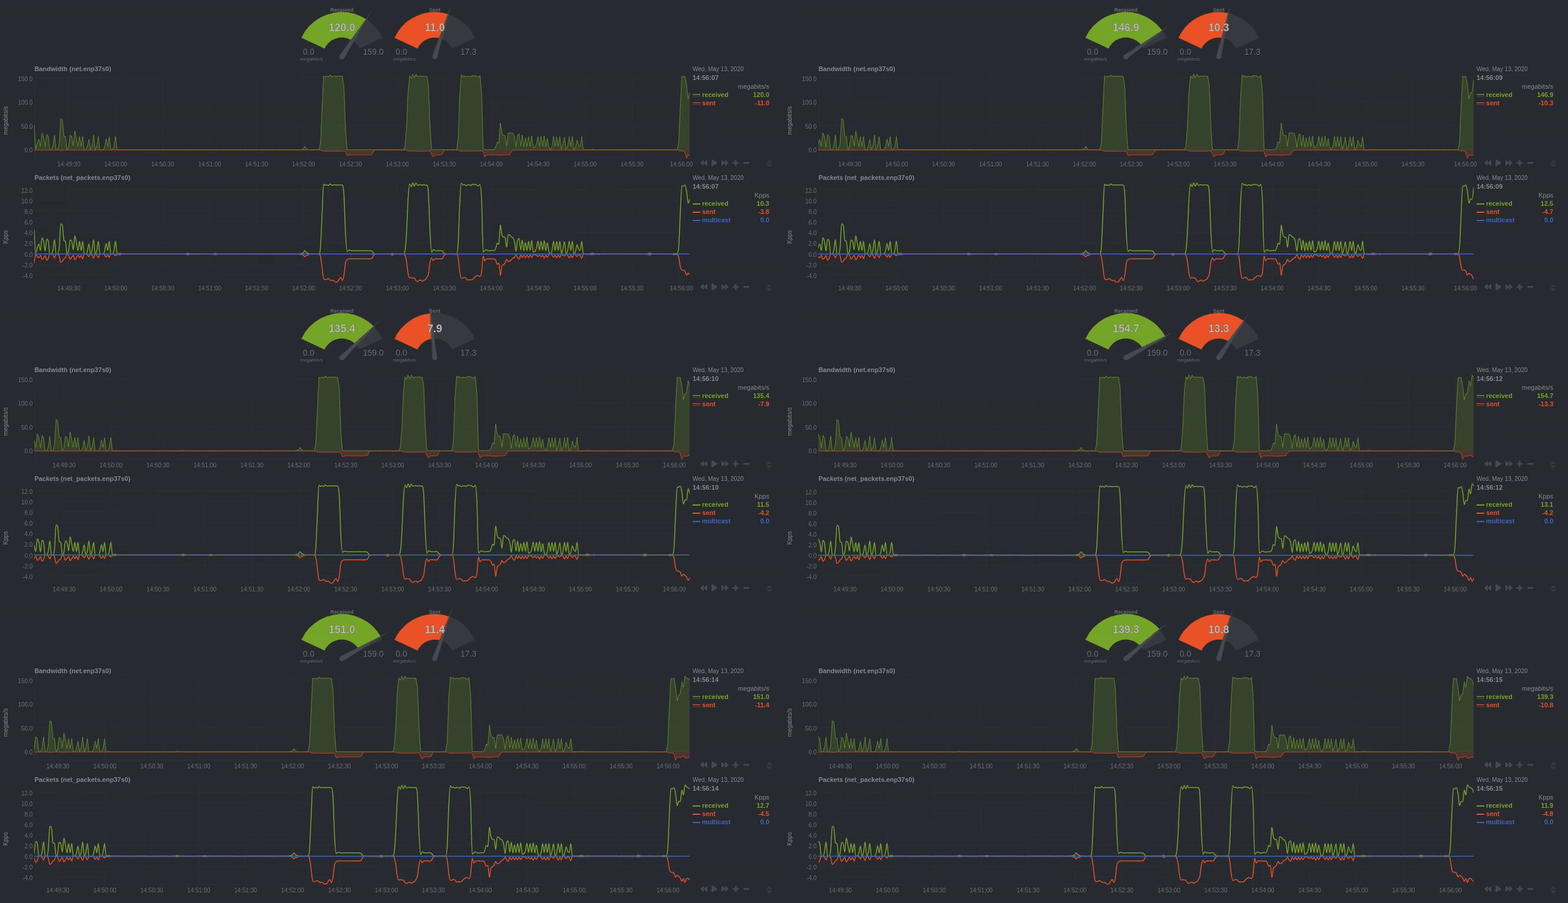 _Netdata charts showing the bandwidth and packets of a network interface. `received` is positive and `sent` is negative._ @@ -346,7 +347,8 @@ negative._ Netdata charts automatically zoom vertically, to visualize the variation of each metric within the visible time-frame. -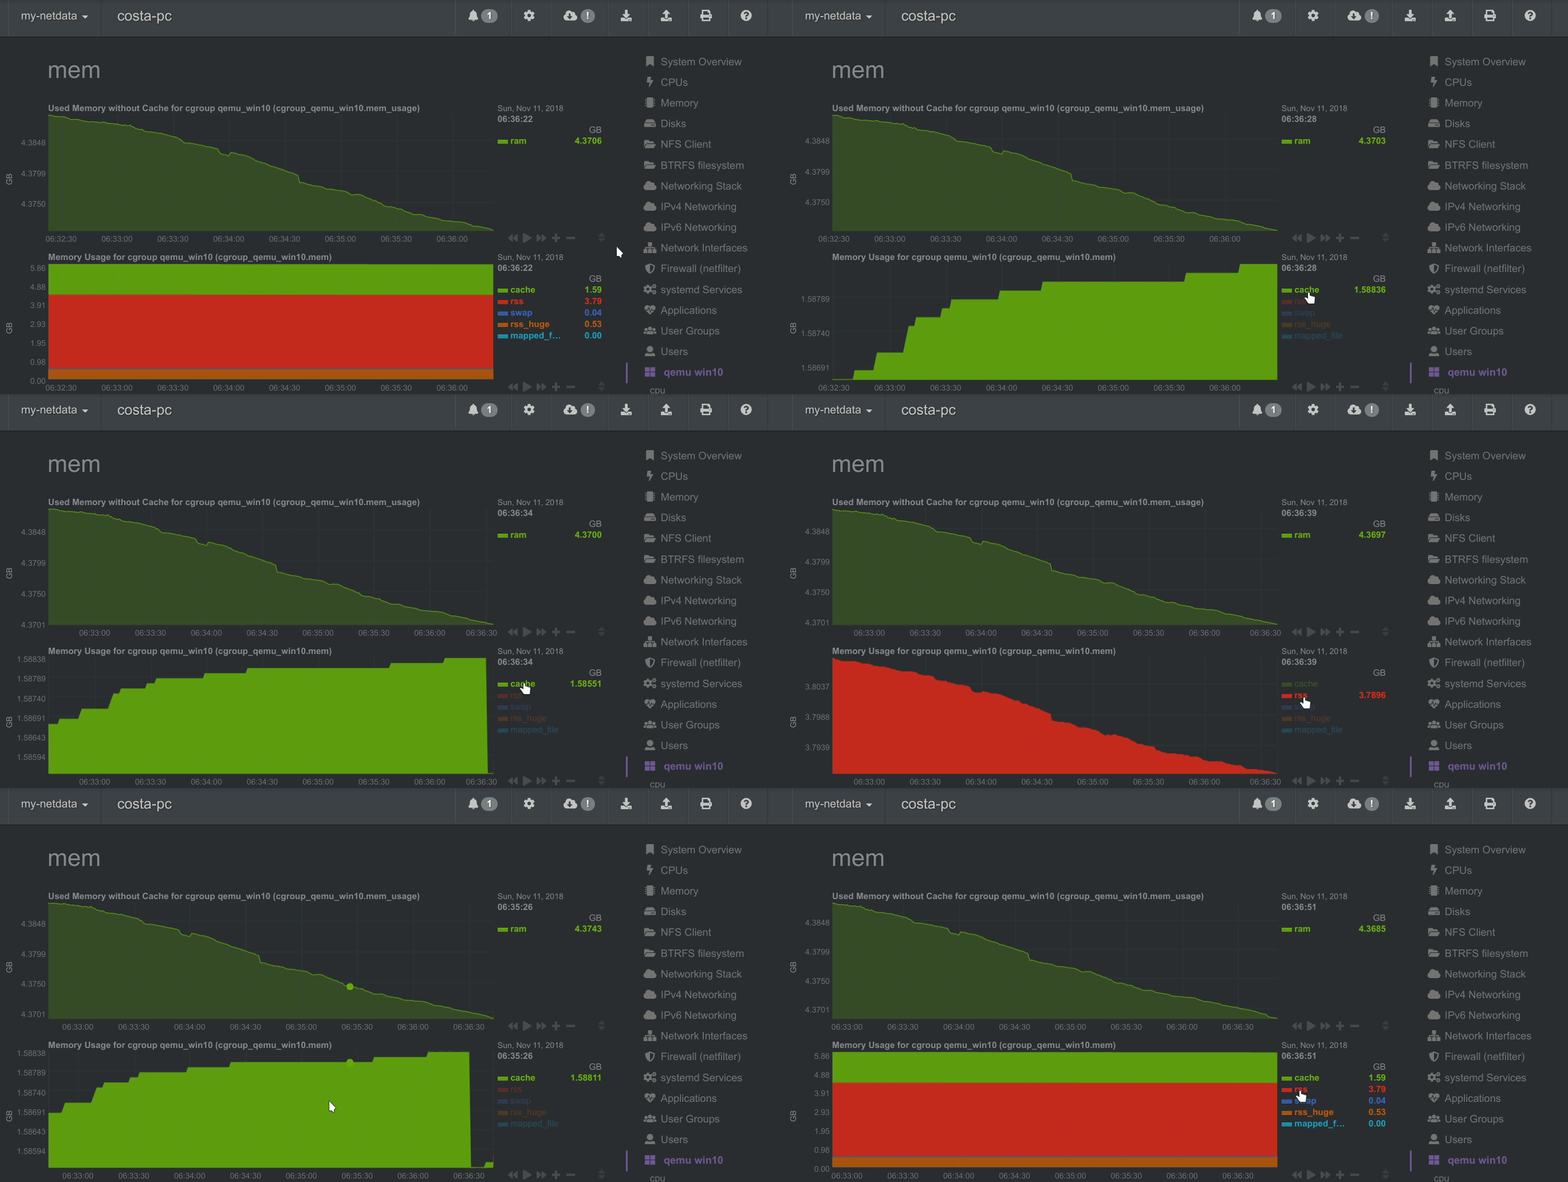 + _A zero-based `stacked` chart, automatically switches to an auto-scaled `area` chart when a single dimension is selected._ @@ -356,27 +358,23 @@ selected._ Charts on Netdata dashboards are synchronized to each other. There is no master chart. Any chart can be panned or zoomed at any time, and all other charts will follow. -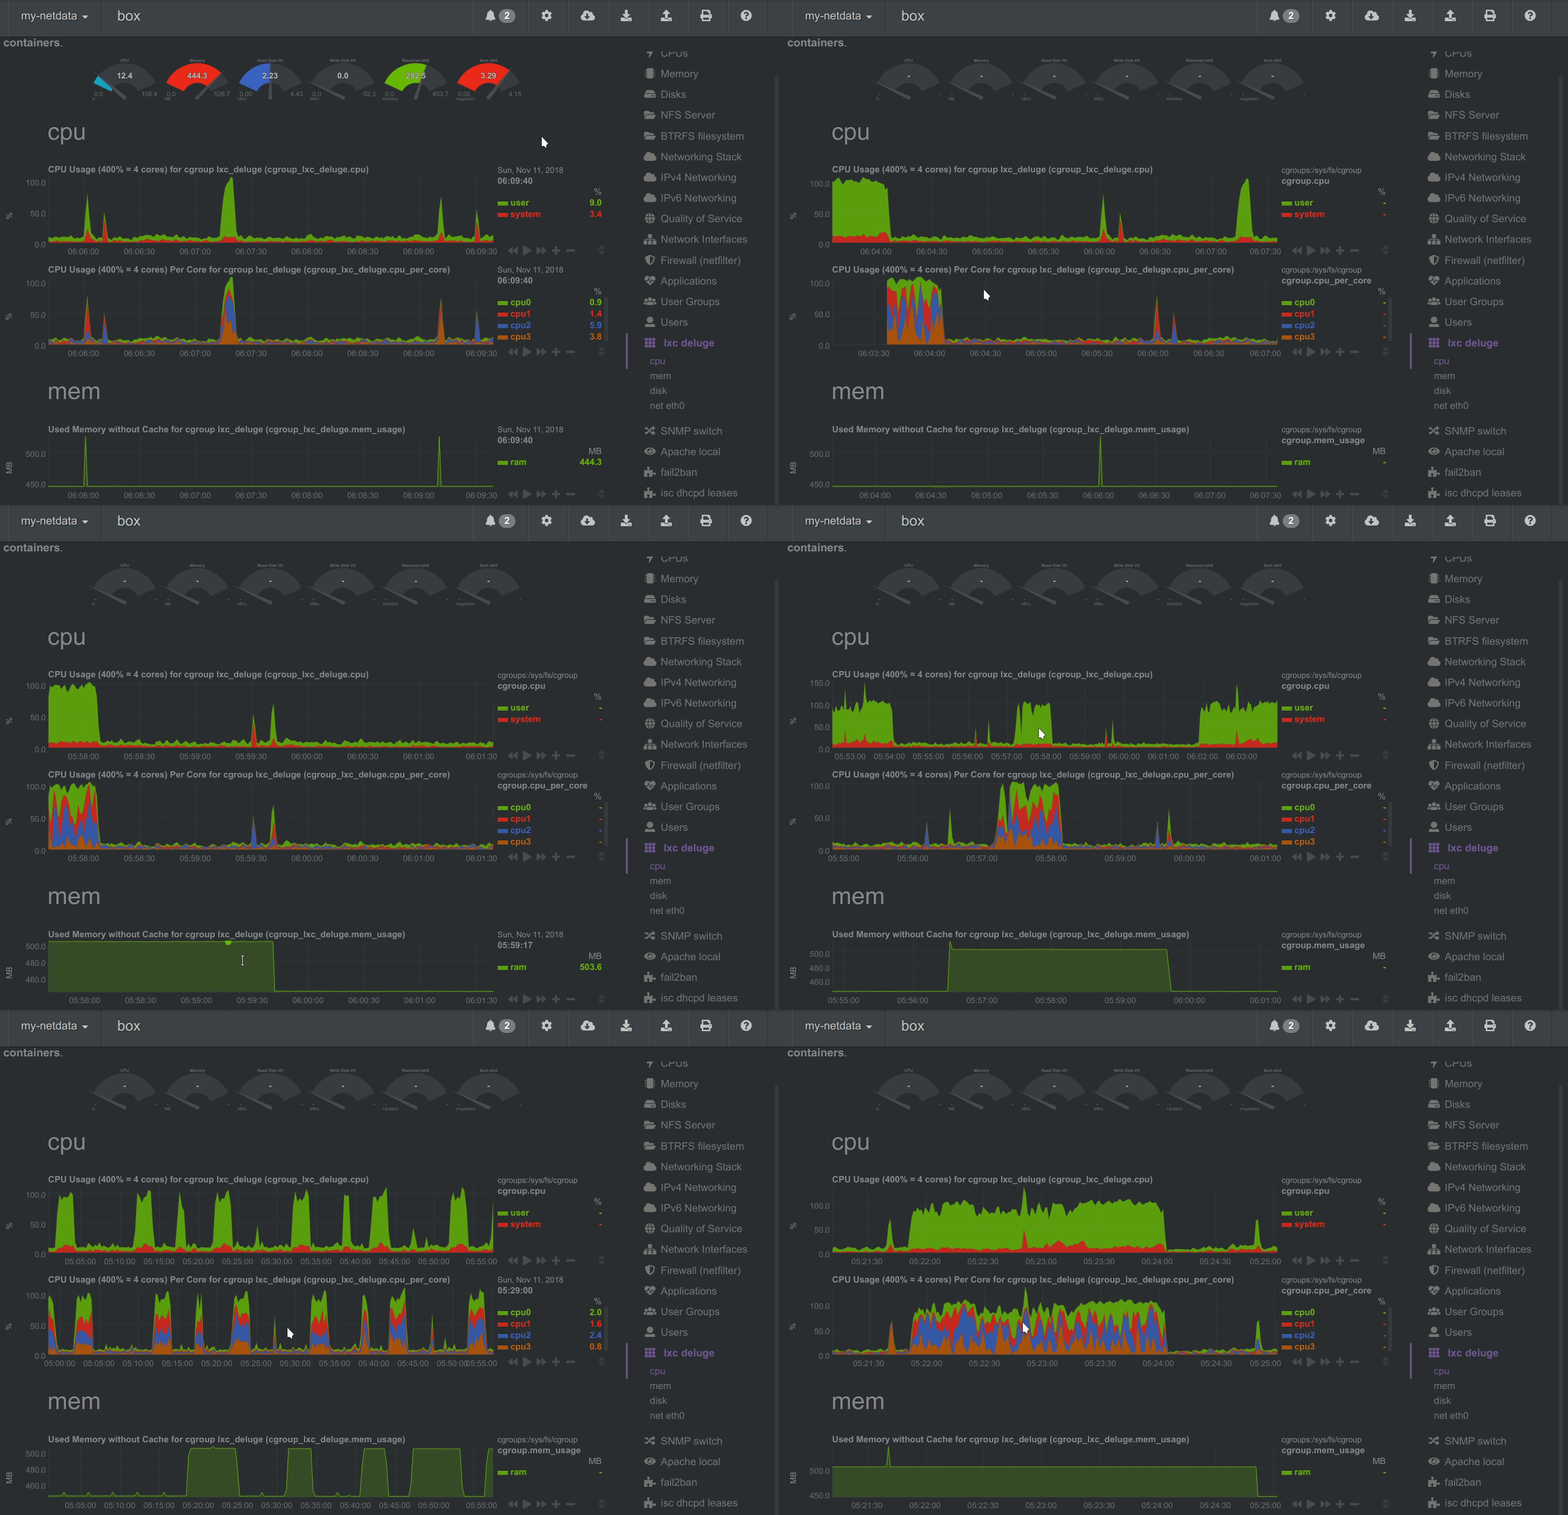 +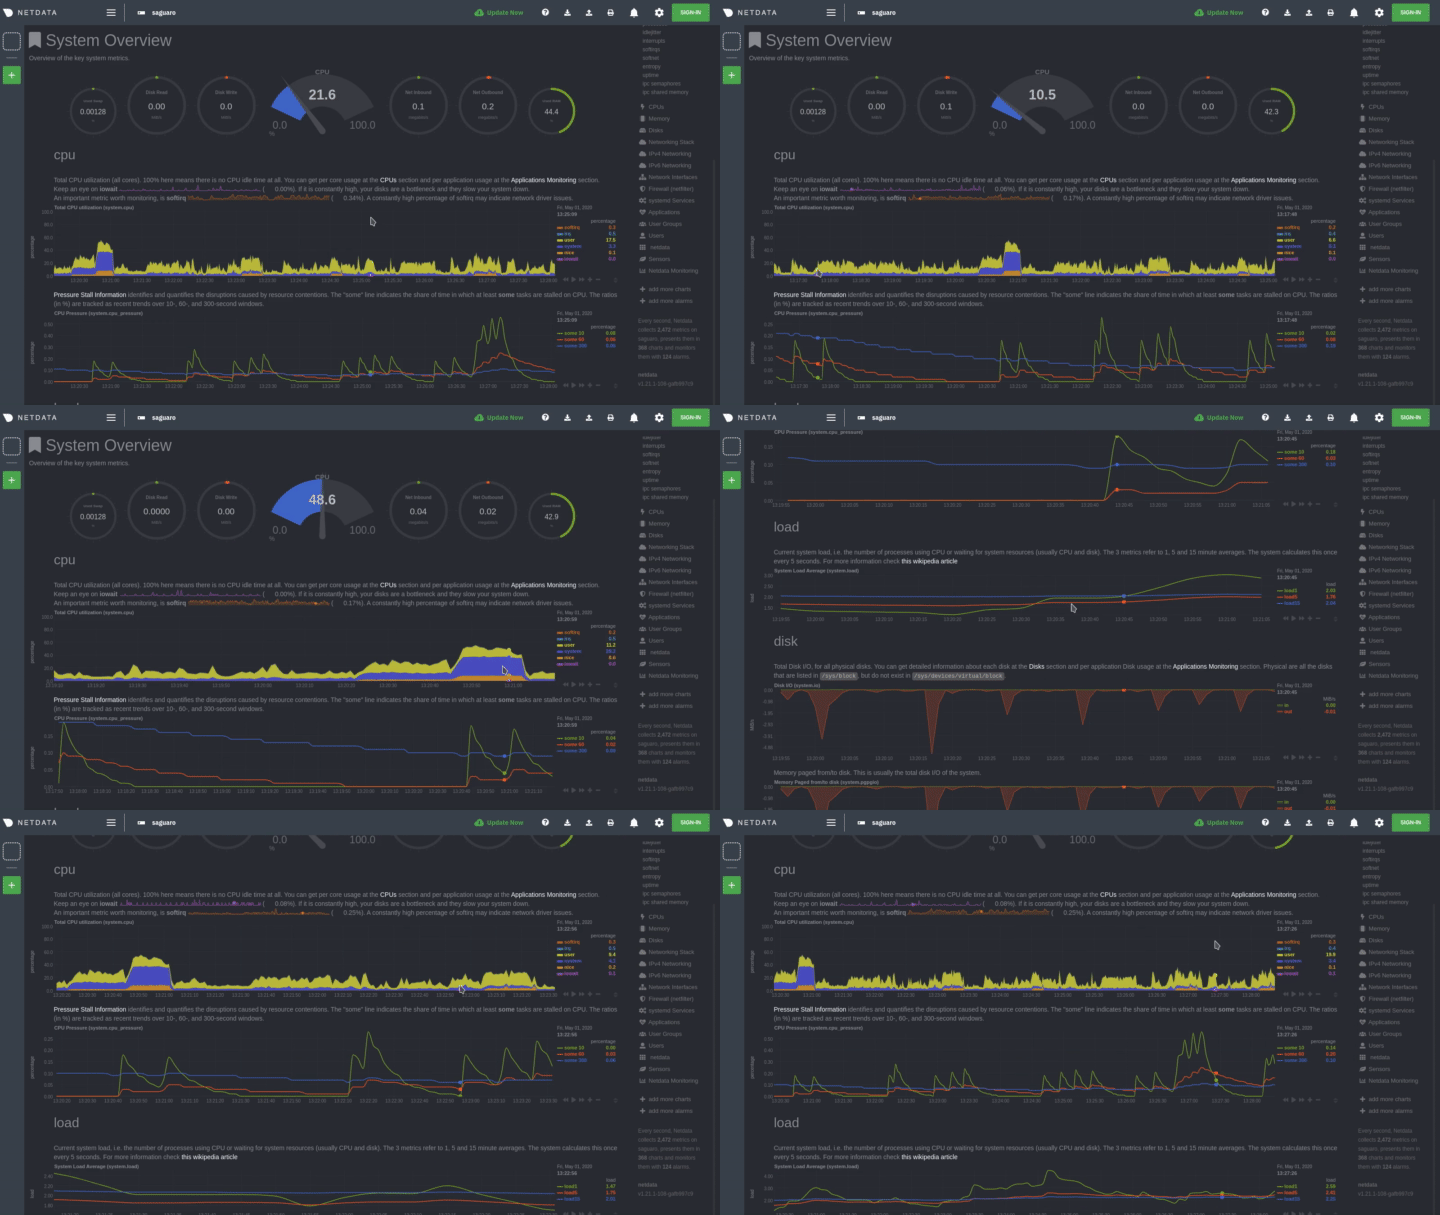 _Charts are panned by dragging them with the mouse. Charts can be zoomed in/out with`SHIFT` + `mouse wheel` while the mouse pointer is over a chart._ -> The visible time-frame (pan and zoom) is propagated from Netdata server to Netdata server when navigating via the -> [My nodes menu](/registry/README.md). - ### Highlighted time-frame To improve visual anomaly detection across charts, the user can highlight a time-frame (by pressing `Alt` + `mouse selection`) on all charts. -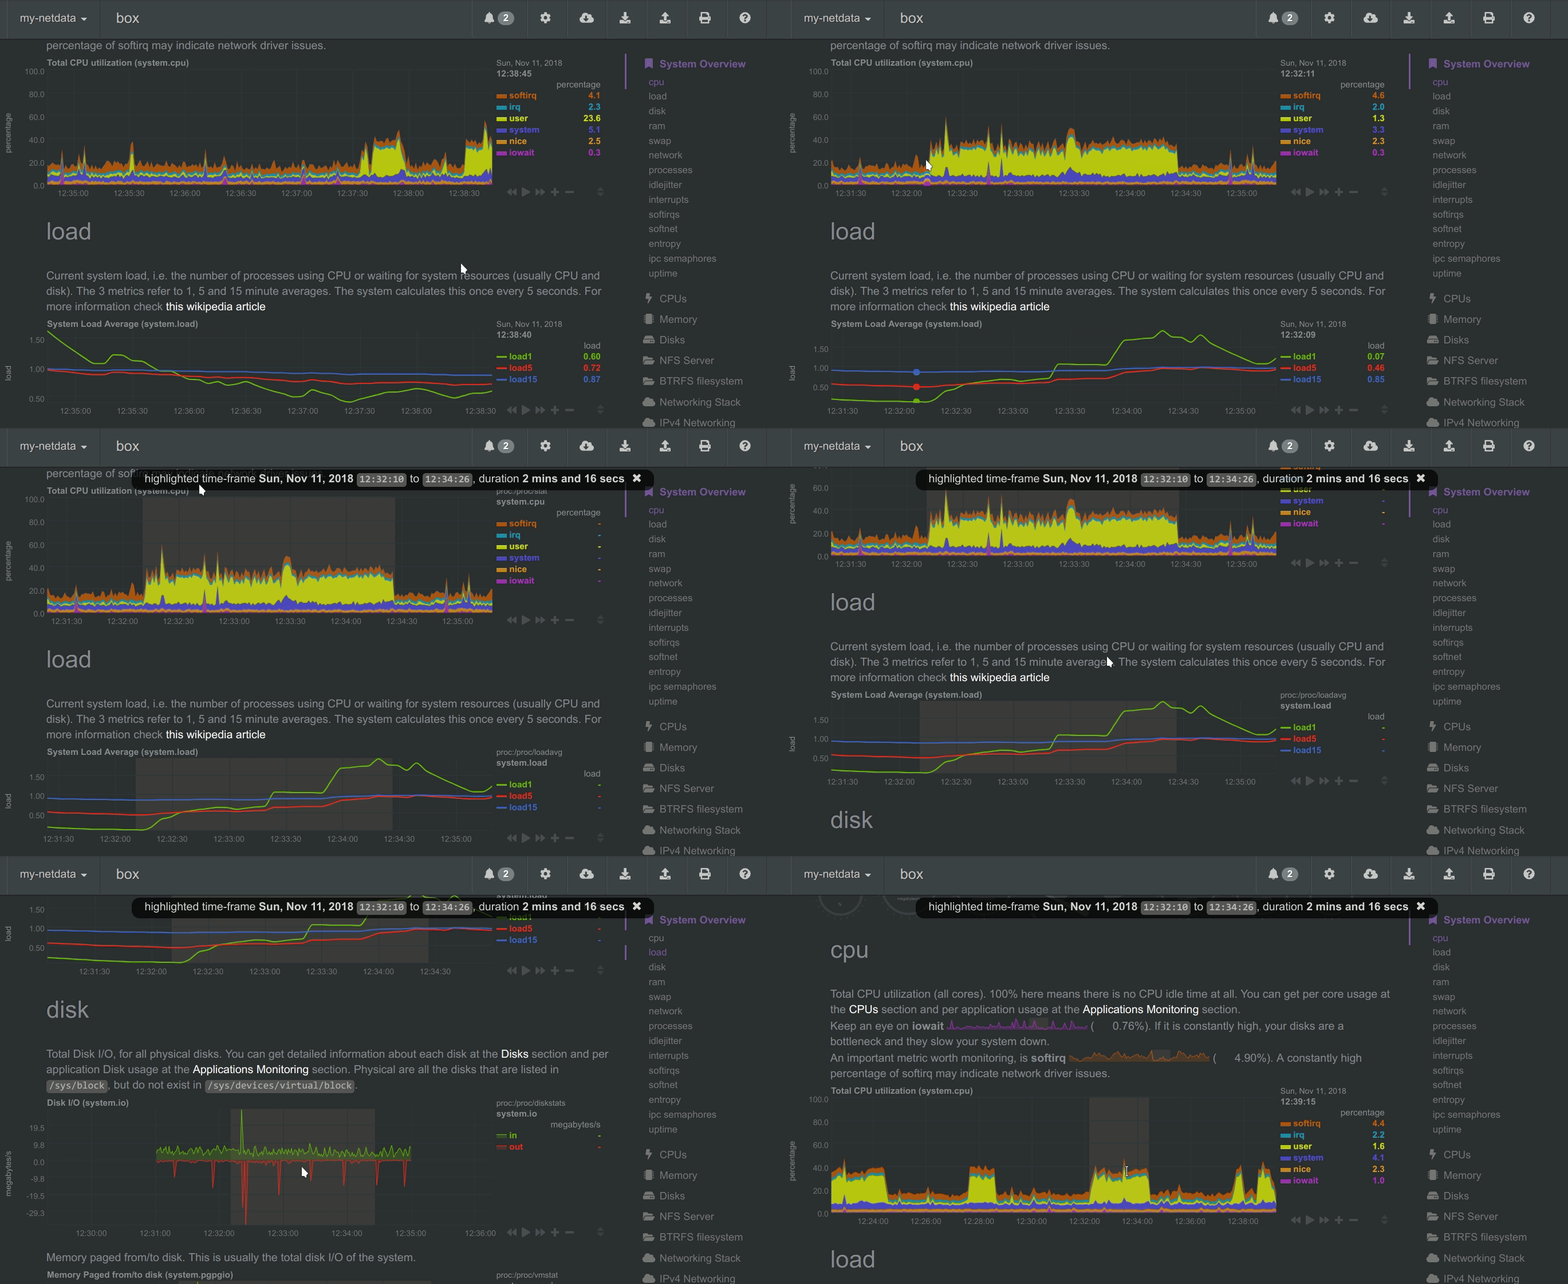 +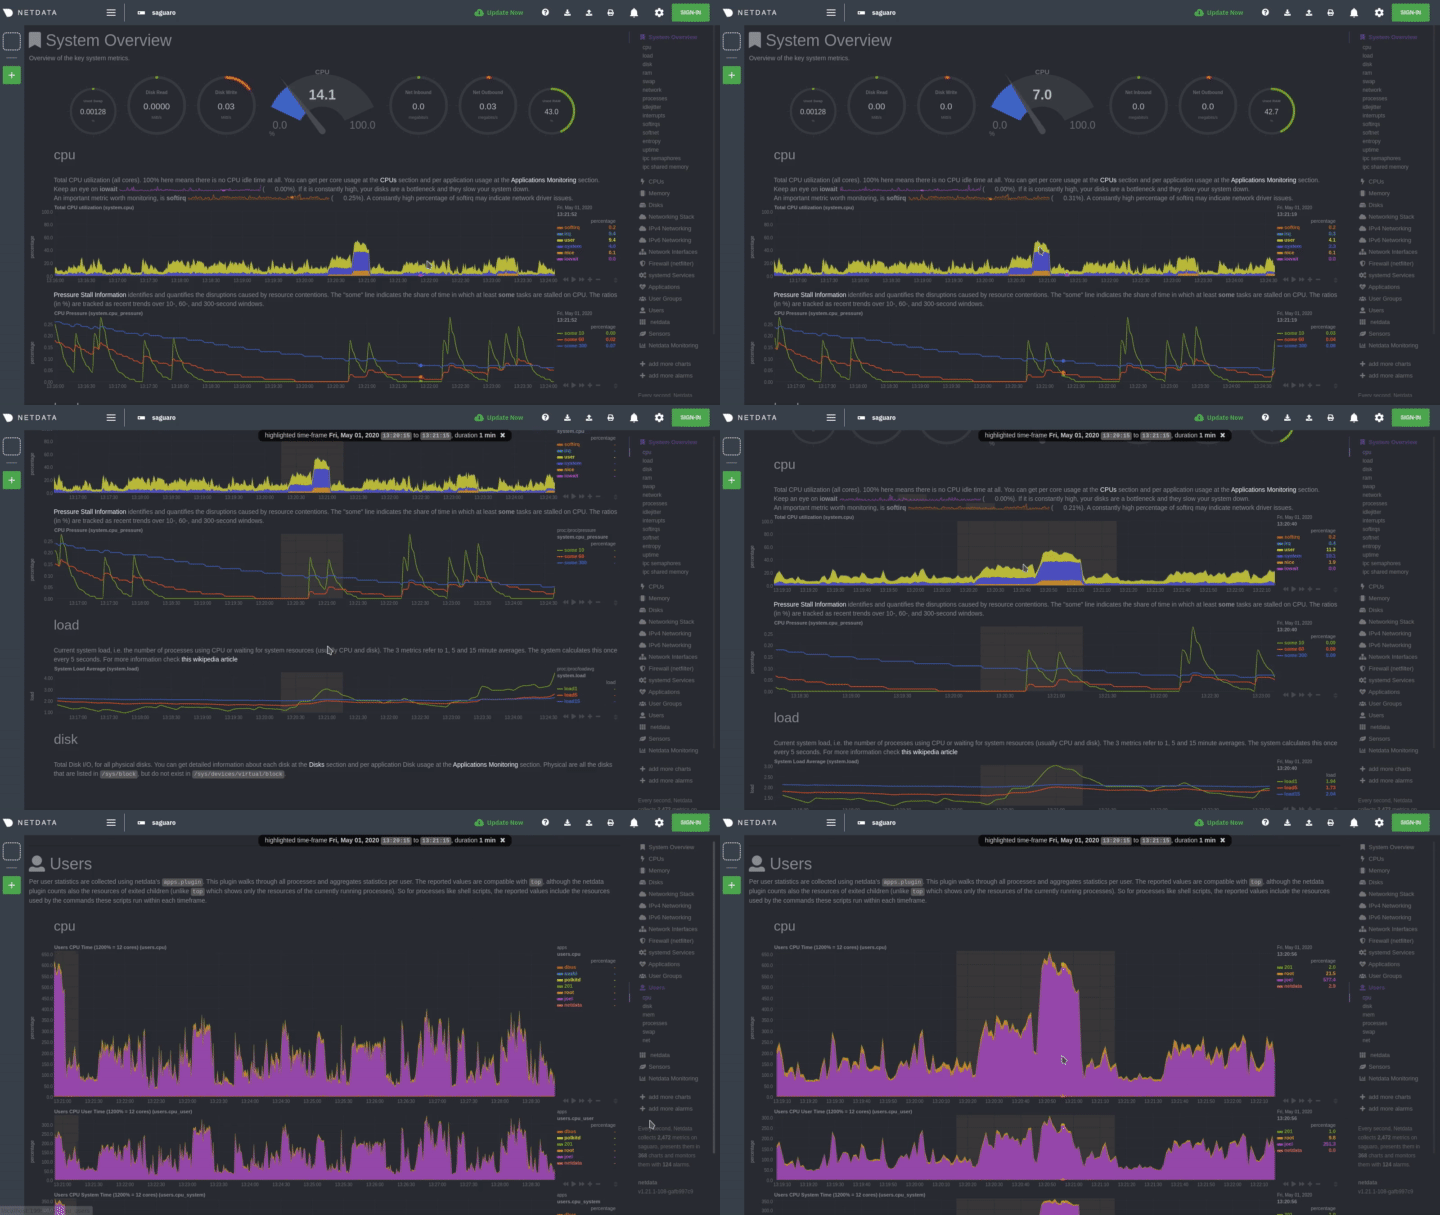 _A highlighted time-frame can be given by pressing `Alt` + `mouse selection` on any chart. Netdata will highlight the same range on all charts._ -> Highlighted ranges are propagated from Netdata server to Netdata server, when navigating via the [My nodes -> menu](/registry/README.md). - ## What Netdata monitors Netdata can collect metrics from 200+ popular services and applications, on top of dozens of system-related metrics |
