
diff options
| author | Joel Hans <joel@netdata.cloud> | 2021-05-05 10:17:21 -0700 |
|---|---|---|
| committer | GitHub <noreply@github.com> | 2021-05-05 10:17:21 -0700 |
| commit | 4a87b0f92e891aa52062c2f488df0c33cf2942e8 (patch) | |
| tree | f7c41a09ac051887d88a6937aceaef368514986c | |
| parent | 261858b8529efaceab2c7fe75ac80ba6660466dc (diff) | |
Improve dashboard documentation (part 2) (#11065)
* Finish initial draft
* Finish with draft of installation flow
* Change analytics path
* Rename file and improve flow
* Init new files
* Init new dashboard files
* Init new file
* Finish revising existing docs
* Finish initial draft
* Finish with draft of installation flow
* Change analytics path
* Rename file and improve flow
* Init new file
* Finish revising existing docs
* Fix link
* Tweak on contexts for Thiago
* Clarify dimension values and units
* Tweaks for Ilya
| -rw-r--r-- | docs/dashboard/dimensions-contexts-families.mdx | 92 | ||||
| -rw-r--r-- | docs/dashboard/how-dashboard-works.mdx | 4 | ||||
| -rw-r--r-- | docs/dashboard/interact-charts.mdx | 7 | ||||
| -rw-r--r-- | docs/dashboard/select-timeframes.mdx | 79 | ||||
| -rw-r--r-- | docs/store/change-metrics-storage.md | 7 |
5 files changed, 182 insertions, 7 deletions
diff --git a/docs/dashboard/dimensions-contexts-families.mdx b/docs/dashboard/dimensions-contexts-families.mdx new file mode 100644 index 0000000000..6e401d4928 --- /dev/null +++ b/docs/dashboard/dimensions-contexts-families.mdx @@ -0,0 +1,92 @@ +--- +title: "Chart dimensions, contexts, and families" +description: "Netdata organizes charts into dimensions, contexts, and families to automatically and meaningfully organize thousands of metrics into interactive charts." +type: explanation +custom_edit_url: https://github.com/netdata/netdata/edit/master/docs/dashboard/dimensions-contexts-families.mdx +--- + +# Chart dimensions, contexts, and families + +While Netdata's charts require no configuration and are [easy to interact with](/docs/dashboards/interact-charts.mdx), +they have a lot of underlying complexity. To meaningfully organize charts out of the box based on what's happening in +your nodes, Netdata uses the concepts of **dimensions**, **contexts**, and **families**. + +Understanding how these work will help you more easily navigate the dashboard, [write new +alarms](/docs/monitor/configure-alars.md), or play around with the [API](/web/api/README.md). + +For a refresher on the anatomy of a chart, see [dashboards and charts](/docs/dashboards/dashboards-charts.mdx). + +## Dimension + +A **dimension** is a value that gets shown on a chart. The value can be raw data or calculated values, such as the +average (the default), minimum, or maximum. These values can then be given any type of unit. For example, CPU +utilization is represented as a percentage, disk I/O as `MiB/s`, and available RAM as an absolute value in `MiB` or +`GiB`. + +Beneath every chart (or on the right-side if you [configure the +dashboard](/docs/dashboards/customize.mdx#change-chart-legend-position)) is a legend of dimensions. When there are +multiple dimensions, you'll see a different entry in the legend for each dimension. + +The **Apps CPU Time** chart (with the [context](#contexts) `apps.cpu`), which visualizes CPU utilization of +different types of processes/services/applications on your node, always provides a vibrant example of a chart with +multiple dimensions. + +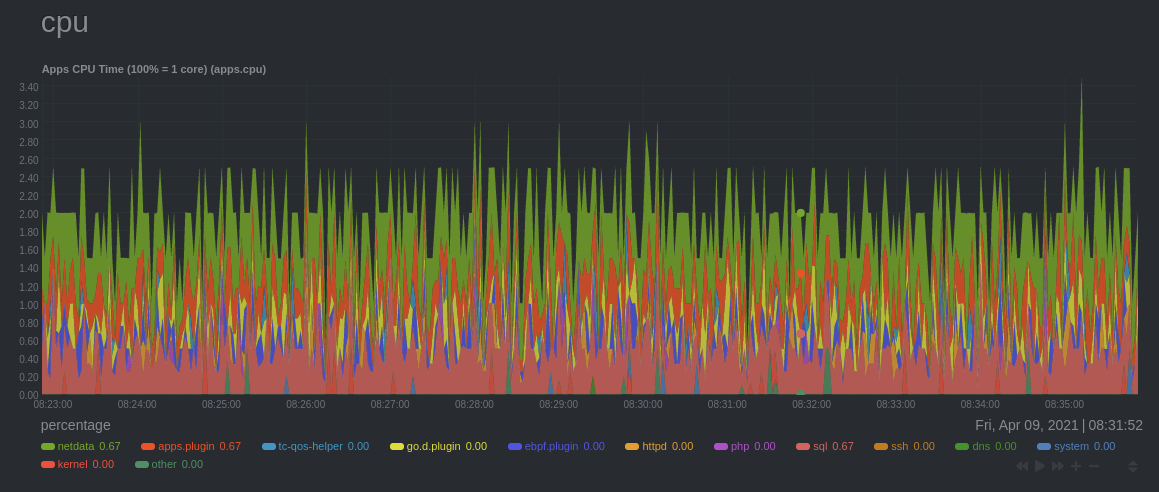 + +The chart shows 13 unique dimensions, such as `httpd` for the CPU utilization for web servers, `kernel` for anything +related to the Linux kernel, and so on. In your dashboard, these specific dimensions will almost certainly be different. + +Dimensions can be [hidden](/docs/dashboards/interact-charts.mdx#show-and-hide-dimensions) to help you focus your +attention. + +## Context + +A **context** is a way of grouping charts by the types of metrics collected and dimensions displayed. It's kind of like +a machine-readable naming and organization scheme. + +For example, the **Apps CPU Time** has the context `apps.cpu`. A little further down on the dashboard is a similar +chart, **Apps Real Memory (w/o shared)** with the context `apps.mem`. The `apps` portion of the context is the **type**, +whereas anything after the `.` is specified either by the chart's developer or by the [**family**](#family). + +By default, a chart's type affects where it fits in the menu, while its family creates submenus. + +Netdata also relies on contexts for [alarm configuration](/docs/monitor/configure-alarms.md) (the [`on` +line](/health/REFERENCE.md#alarm-line-on)). + +## Family + +**Families** are a _single instance_ of a hardware or software resource that needs to be displayed separately from +similar instances. + +For example, let's look at the **Disks** section, which contains a number of charts with contexts like `disk.io`, +`disk.ops`, `disk.backlog`, and `disk.util`. If your node has multiple disk drives at `sda` and `sdb`, Netdata creates +a separate family for each. + +Netdata now merges the contexts and families to create charts that are grouped by family, following a +`[context].[family]` naming scheme, so that you can see the `disk.io` and `disk.ops` charts for `sda` right next to each +other. + +Given the four example contexts, and two families of `sda` and `sdb`, Netdata will create the following charts and their +names: + +| Context | `sda` family | `sdb` family | +| :------------- | ------------------ | ------------------ | +| `disk.io` | `disk_io.sda` | `disk_io.sdb` | +| `disk.ops` | `disk_ops.sda` | `disk_ops.sdb` | +| `disk.backlog` | `disk_backlog.sda` | `disk_backlog.sdb` | +| `disk.util` | `disk_util.sda` | `disk_util.sdb` | + +## What's next? + +With an understanding of a chart's dimensions, context, and family, you're now ready to dig even deeper into Netdata's +dashboard. We recommend looking into [using the timeframe selector](/docs/dashboards/select-timeframes.mdx). + +If you feel comfortable with the [dashboard](/docs/dashboard/how-dashboard-works.mdx) and interacting with charts, we +recommend learning about [configuration](/docs/configure/nodes.md). While Netdata doesn't _require_ a complicated setup +process or a query language to create charts, there are a lot of ways to tweak the experience to match your needs. + +### Further reading & related information + +- [How the dashboard works](/docs/dashboard/how-dashboard-works.mx) +- [Interact with charts](/docs/dashboard/interact-charts.mdx) diff --git a/docs/dashboard/how-dashboard-works.mdx b/docs/dashboard/how-dashboard-works.mdx index 1c0e2bdd99..64887e84b8 100644 --- a/docs/dashboard/how-dashboard-works.mdx +++ b/docs/dashboard/how-dashboard-works.mdx @@ -95,7 +95,9 @@ method](/docs/monitor/enable-notifications.md). ## What's next? Learn more about [interacting with charts](/docs/dashboard/interact-charts.mdx) to quickly pan through time, zoom, and -show/hide dimensions to best understand the state of your node in any timeframe. +show/hide dimensions to best understand the state of your node in any timeframe. A complete understanding of [chart +dimensions, contexts, and families](/docs/dashboard/dimensions-contexts-families.mdx) will also help with how Netdata +organizes its dashboard and operates [alarms](/docs/monitor/configure-alarms.md). ### Further reading & related information diff --git a/docs/dashboard/interact-charts.mdx b/docs/dashboard/interact-charts.mdx index d0a447bd43..a7d42e2356 100644 --- a/docs/dashboard/interact-charts.mdx +++ b/docs/dashboard/interact-charts.mdx @@ -116,9 +116,10 @@ are, respectively, `Pan Left`, `Reset`, `Pan Right`, `Zoom In`, and `Zoom Out`. ## What's next? -<!-- We recommend you read up on the differences between [charts, contexts, dimensions, and -families](/docs/dashboards/chart-dimensions-contexts-families.mdx) to complete your understanding of how Netdata's -dashboards are organized. --> +We recommend you read up on the differences between [chart dimensions, contexts, and +families](/docs/dashboard/dimensions-contexts-families.mdx) to complete your understanding of how Netdata organizes its +dashboards. Another valuable way to interact with charts is to use the [timeframe +selector](/docs/dashboard/select-timeframes.mdx), which helps you visualize specific moments of historical metrics. If you feel comfortable with the [dashboard](/docs/dashboard/how-dashboard-works.mdx) and interacting with charts, we recommend moving on to learning about [configuration](/docs/configure/nodes.md). While Netdata doesn't _require_ a diff --git a/docs/dashboard/select-timeframes.mdx b/docs/dashboard/select-timeframes.mdx new file mode 100644 index 0000000000..6385ace1eb --- /dev/null +++ b/docs/dashboard/select-timeframes.mdx @@ -0,0 +1,79 @@ +--- +title: "Select timeframes to visualize" +description: "Netdata's dashboard features a rich timeframe selector, with useful defaults and rich customization, to help you narrow your focus when troubleshooting issues or anomalies." +type: how-to +custom_edit_url: https://github.com/netdata/netdata/edit/master/docs/dashboard/select-timeframes.mdx +--- + +# Pick timeframes to visualize + +While [panning through time and zooming in/out](/docs/dashboard/interact-charts.mdx) from charts is helpful when +you're looking a recent history, or want to do granular troubleshooting, what if you want to see metrics from 6 hours +ago? Or 6 days? + +Netdata's dashboard features a **timeframe selector** to help you visualize specific timeframes in a few helpful ways. +By default, it shows a certain number of minutes of historical metrics based on the your browser's viewport to ensure +it's always showing per-second granularity. + +## Open the timeframe selector + +To visualize a new timeframe, you need to open the picker, which appears just above the menu, near the top-right cover +of the dashboard. + +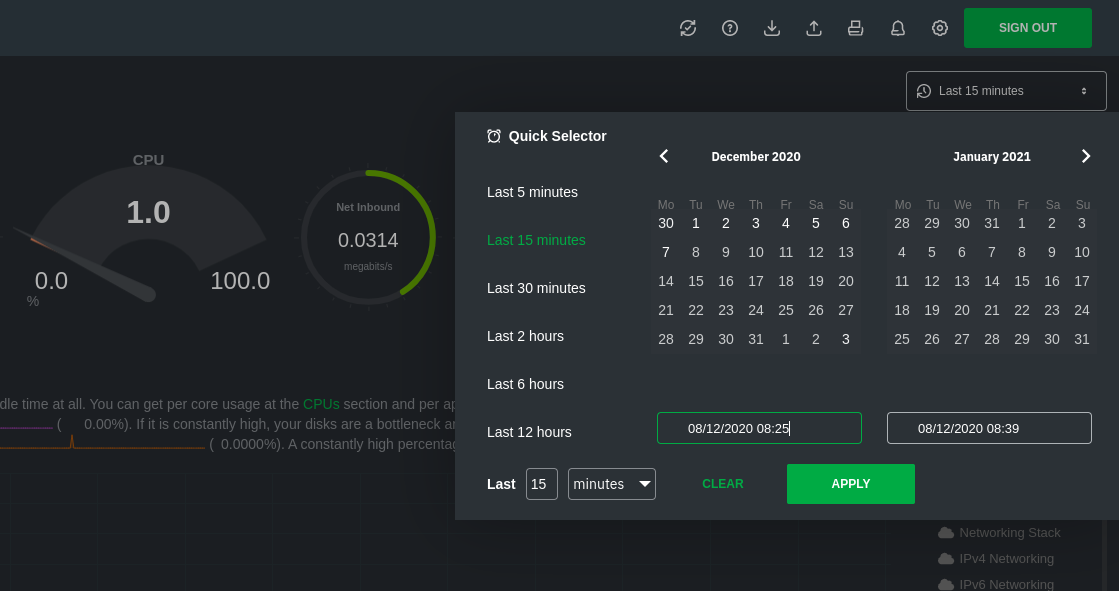 + +The **Clear** button resets the dashboard back to its default state based on your browser viewport, and **Apply** closes +the picker and shifts all charts to the selected timeframe. + +## Use the Quick Selector + +Click any of the following options in the **Quick Selector** to choose a commonly-used timeframe. + +- Last 5 minutes +- Last 15 minutes +- Last 2 hours +- Last 6 hours +- Last 12 hours + +Click **Apply** to see metrics from your selected timeframe. + +## Choose a specific interval + +Beneath the Quick Selector is an input field and dropdown you use in combination to select a specific timeframe of +minutes, hours, days, or months. Enter a number and choose the appropriate unit of time, then click **Apply**. + +## Choose multiple days + +Use the calendar to select multiple days. Click on a date to begin the timeframe selection, then an ending date. The +timeframe begins at noon on the beginning and end dates. Click **Apply** to see your selected multi-day timeframe. + +## Caveats and considerations + +**Longer timeframes will decrease metrics granularity**. At the default timeframe, based on your browser viewport, each +"tick" on charts represents one second. If you select a timeframe of 6 hours, each tick represents the _average_ value +across a larger period of time. + +**You can only see metrics as far back in history as your metrics retention policy allows**. Netdata uses an internal +time-series database (TSDB) to store as many metrics as it can within a specific amount of disk space. The default +storage is 256 MiB, which should be enough for 1-3 days of historical metrics. If you navigate back to a timeframe +beyond stored historical metrics, you'll see this message: + +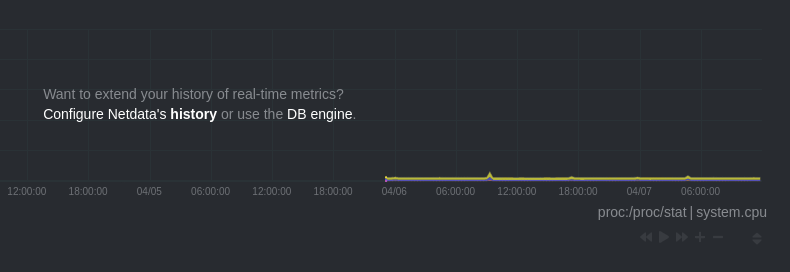 + +At any time, [configure the internal TSDB's storage capacity](/docs/store/change-metrics-storage.md) to expand your +depth of historical metrics. + +## What's next? + +<!-- We recommend you dive deeper into some additional dashboard features, such as [import/exporting +snapshots](/docs/dashboards/import-export-snapshots.mdx) or +[customization](/docs/dashboards/customize-standard-dashboard.mdx). --> + + + +### Further reading & related information + +- [Interact with charts](/docs/dashboards/interact-charts.mdx) +- [Database engine reference](/database/engine/README.md) diff --git a/docs/store/change-metrics-storage.md b/docs/store/change-metrics-storage.md index 46b4dea9cb..2ed026c5c1 100644 --- a/docs/store/change-metrics-storage.md +++ b/docs/store/change-metrics-storage.md @@ -60,9 +60,10 @@ method](/docs/configure/start-stop-restart.md) for your system, to change the da ## What's next? -If you have multiple nodes with the Netdata Agent installed, you can [stream metrics](/docs/store/stream-metrics.md) -from any number of _child_ nodes to a _parent_ node and store metrics using a centralized time-series database.Streaming -allows you to centralize your data, run Agents as headless collectors, replicate data, and more. +If you have multiple nodes with the Netdata Agent installed, you can [stream +metrics](/docs/metrics-storage-management/how-streaming-works.mdx) from any number of _child_ nodes to a _parent_ node +and store metrics using a centralized time-series database. Streaming allows you to centralize your data, run Agents as +headless collectors, replicate data, and more. Storing metrics with the database engine is completely interoperable with [exporting to other time-series databases](/docs/export/external-databases.md). With exporting, you can use the node's resources to surface metrics |