
diff options
| author | Joel Hans <joel@netdata.cloud> | 2021-01-07 09:53:10 -0700 |
|---|---|---|
| committer | GitHub <noreply@github.com> | 2021-01-07 09:53:10 -0700 |
| commit | 0bb7a429b619bc68104983691e4f957482630787 (patch) | |
| tree | 040bc96ddd98ac59d7e83235f2babccc01ecb636 | |
| parent | 3adf54ff452fbe8216b64dfce9c7ec04bc7a270b (diff) | |
Small updates, improvements, and housekeeping to docs (#10405)
* Fix Berkeley mentions
* Add new collectors to list
* Tweak Prometheus/OpenMetrics phrasing
* Fix heading depth in performance guide
* Clarify that exporting starts with Agent start
* Clarify usage of edit-config with new files
* Update images
* service -> systemctl
* Reverse systemctl order
| -rw-r--r-- | collectors/COLLECTORS.md | 15 | ||||
| -rw-r--r-- | collectors/python.d.plugin/boinc/README.md | 2 | ||||
| -rw-r--r-- | docs/export/enable-connector.md | 13 | ||||
| -rw-r--r-- | docs/getting-started.md | 26 | ||||
| -rw-r--r-- | docs/guides/configure/performance.md | 11 | ||||
| -rw-r--r-- | docs/monitor/configure-alarms.md | 14 | ||||
| -rw-r--r-- | docs/quickstart/infrastructure.md | 2 | ||||
| -rw-r--r-- | docs/visualize/create-dashboards.md | 17 | ||||
| -rw-r--r-- | docs/visualize/interact-dashboards-charts.md | 6 | ||||
| -rw-r--r-- | docs/visualize/overview-infrastructure.md | 2 | ||||
| -rw-r--r-- | exporting/README.md | 3 |
11 files changed, 57 insertions, 54 deletions
diff --git a/collectors/COLLECTORS.md b/collectors/COLLECTORS.md index de28592ca7..939594e0ce 100644 --- a/collectors/COLLECTORS.md +++ b/collectors/COLLECTORS.md @@ -44,7 +44,7 @@ collector—we may be looking for contributions from users such as yourself! If - [System collectors](#system-collectors) - [Applications](#applications) - [Disks and filesystems](#disks-and-filesystems) - - [eBPF (extended Berkely Backet Filter)](#ebpf) + - [eBPF (extended Berkeley Packet Filter)](#ebpf) - [Hardware](#hardware) - [Memory](#memory) - [Networks](#networks) @@ -64,8 +64,7 @@ configure any of these collectors according to your setup and infrastructure. ### Generic - [Prometheus endpoints](https://learn.netdata.cloud/docs/agent/collectors/go.d.plugin/modules/prometheus): Gathers - metrics from one or more Prometheus endpoints that use the OpenMetrics exposition format. Autodetects more than 600 - endpoints. + metrics from any number of Prometheus endpoints, with support to autodetect more than 600 services and applications. ### APM (application performance monitoring) @@ -111,6 +110,8 @@ configure any of these collectors according to your setup and infrastructure. database components using `_status/vars` endpoint. - [Consul](https://learn.netdata.cloud/docs/agent/collectors/go.d.plugin/modules/consul/): Capture service and unbound checks status (passing, warning, critical, maintenance). +- [Couchbase](https://learn.netdata.cloud/docs/agent/collectors/go.d.plugin/modules/couchbase/): Gather per-bucket + metrics from any number of instances of the distributed JSON document database. - [CouchDB](/collectors/python.d.plugin/couchdb/README.md): Monitor database health and performance metrics (reads/writes, HTTP traffic, replication status, etc). - [MongoDB](/collectors/python.d.plugin/mongodb/README.md): Collect memory-caching system performance metrics and @@ -118,11 +119,15 @@ configure any of these collectors according to your setup and infrastructure. - [MySQL](https://learn.netdata.cloud/docs/agent/collectors/go.d.plugin/modules/mysql/): Collect database global, replication and per user statistics. - [OracleDB](/collectors/python.d.plugin/oracledb/README.md): Monitor database performance and health metrics. +- [Pika](https://learn.netdata.cloud/docs/agent/collectors/go.d.plugin/modules/pika/): Gather metric, such as clients, + memory usage, queries, and more from the Redis interface-compatible database. - [Postgres](/collectors/python.d.plugin/postgres/README.md): Collect database health and performance metrics. - [ProxySQL](/collectors/python.d.plugin/proxysql/README.md): Monitor database backend and frontend performance metrics. -- [Redis](/collectors/python.d.plugin/redis/): Monitor database status by reading the server's response to the `INFO` - command. +- [Redis (Go)](https://learn.netdata.cloud/docs/agent/collectors/go.d.plugin/modules/redis/): Monitor status from any + number of database instances by reading the server's response to the `INFO ALL` command. +- [Redis (Python)](/collectors/python.d.plugin/redis/): Monitor database status by reading the server's response to + the `INFO` command. - [RethinkDB](/collectors/python.d.plugin/rethinkdbs/README.md): Collect database server and cluster statistics. - [Riak KV](/collectors/python.d.plugin/riakkv/README.md): Collect database stats from the `/stats` endpoint. - [Zookeeper](https://learn.netdata.cloud/docs/agent/collectors/go.d.plugin/modules/zookeeper/): Monitor application diff --git a/collectors/python.d.plugin/boinc/README.md b/collectors/python.d.plugin/boinc/README.md index ec06396492..bd509c9004 100644 --- a/collectors/python.d.plugin/boinc/README.md +++ b/collectors/python.d.plugin/boinc/README.md @@ -6,7 +6,7 @@ sidebar_label: "BOINC" # BOINC monitoring with Netdata -Monitors task counts for the Berkely Open Infrastructure Networking Computing (BOINC) distributed computing client using the same RPC interface that the BOINC monitoring GUI does. +Monitors task counts for the Berkeley Open Infrastructure Networking Computing (BOINC) distributed computing client using the same RPC interface that the BOINC monitoring GUI does. It provides charts tracking the total number of tasks and active tasks, as well as ones tracking each of the possible states for tasks. diff --git a/docs/export/enable-connector.md b/docs/export/enable-connector.md index c287276086..9789de2d8a 100644 --- a/docs/export/enable-connector.md +++ b/docs/export/enable-connector.md @@ -11,6 +11,9 @@ database](/docs/export/external-databases.md#supported-databases), you can now e connector itself. We'll walk through the process of enabling the exporting engine itself, followed by two examples using the OpenTSDB and Graphite connectors. +> When you enable the exporting engine and a connector, the Netdata Agent exports metrics _beginning from the time you +> restart its process_, not the entire [database of long-term metrics](/docs/store/change-metrics-storage.md). + Once you understand the process of enabling a connector, you can translate that knowledge to any other connector. ## Enable the exporting engine @@ -44,9 +47,9 @@ Use the following configuration as a starting point. Copy and paste it into `exp Replace `my_opentsdb_http_instance` with an instance name of your choice, and change the `destination` setting to the IP address or hostname of your OpenTSDB database. -Restart your Agent with `service netdata restart` to begin exporting to your OpenTSDB database. Because the -Agent exports metrics as they're collected, you should start seeing data in your external database after only a few -seconds. +Restart your Agent with `sudo systemctl restart netdata` to begin exporting to your OpenTSDB database. The Netdata Agent +exports metrics _beginning from the time the process starts_, and because it exports as metrics are collected, you +should start seeing data in your external database after only a few seconds. Any further configuration is optional, based on your needs and the configuration of your OpenTSDB database. See the [OpenTSDB connector doc](/exporting/opentsdb/README.md) and [exporting engine @@ -65,8 +68,8 @@ Use the following configuration as a starting point. Copy and paste it into `exp Replace `my_graphite_instance` with an instance name of your choice, and change the `destination` setting to the IP address or hostname of your Graphite-supported database. -Restart your Agent with `service netdata restart` to begin exporting to your Graphite-supported database. Because the -Agent exports metrics as they're collected, you should start seeing data in your external database after only a few +Restart your Agent with `sudo systemctl restart netdata` to begin exporting to your Graphite-supported database. Because +the Agent exports metrics as they're collected, you should start seeing data in your external database after only a few seconds. Any further configuration is optional, based on your needs and the configuration of your Graphite-supported database. diff --git a/docs/getting-started.md b/docs/getting-started.md index 5ad1a48c00..74597c10b3 100644 --- a/docs/getting-started.md +++ b/docs/getting-started.md @@ -193,30 +193,20 @@ Find the `SEND_EMAIL="YES"` line and change it to `SEND_EMAIL="NO"`. ## Monitor multiple systems with Netdata Cloud If you have the Agent installed on multiple nodes, you can use Netdata Cloud in two ways: Monitor the health and -performance of an entire infrastructure via the Cloud web interface, or use the Visited Nodes menu that's built into -every dashboard. +performance of an entire infrastructure via the Netdata Cloud web application, or use the Visited Nodes menu that's +built into every dashboard. -For example, a small infrastructure monitored via Netdata Cloud: - - - -And the process of using the Visited nodes menu to move between Agent dashboards running on various systems, both local -and remote: - - +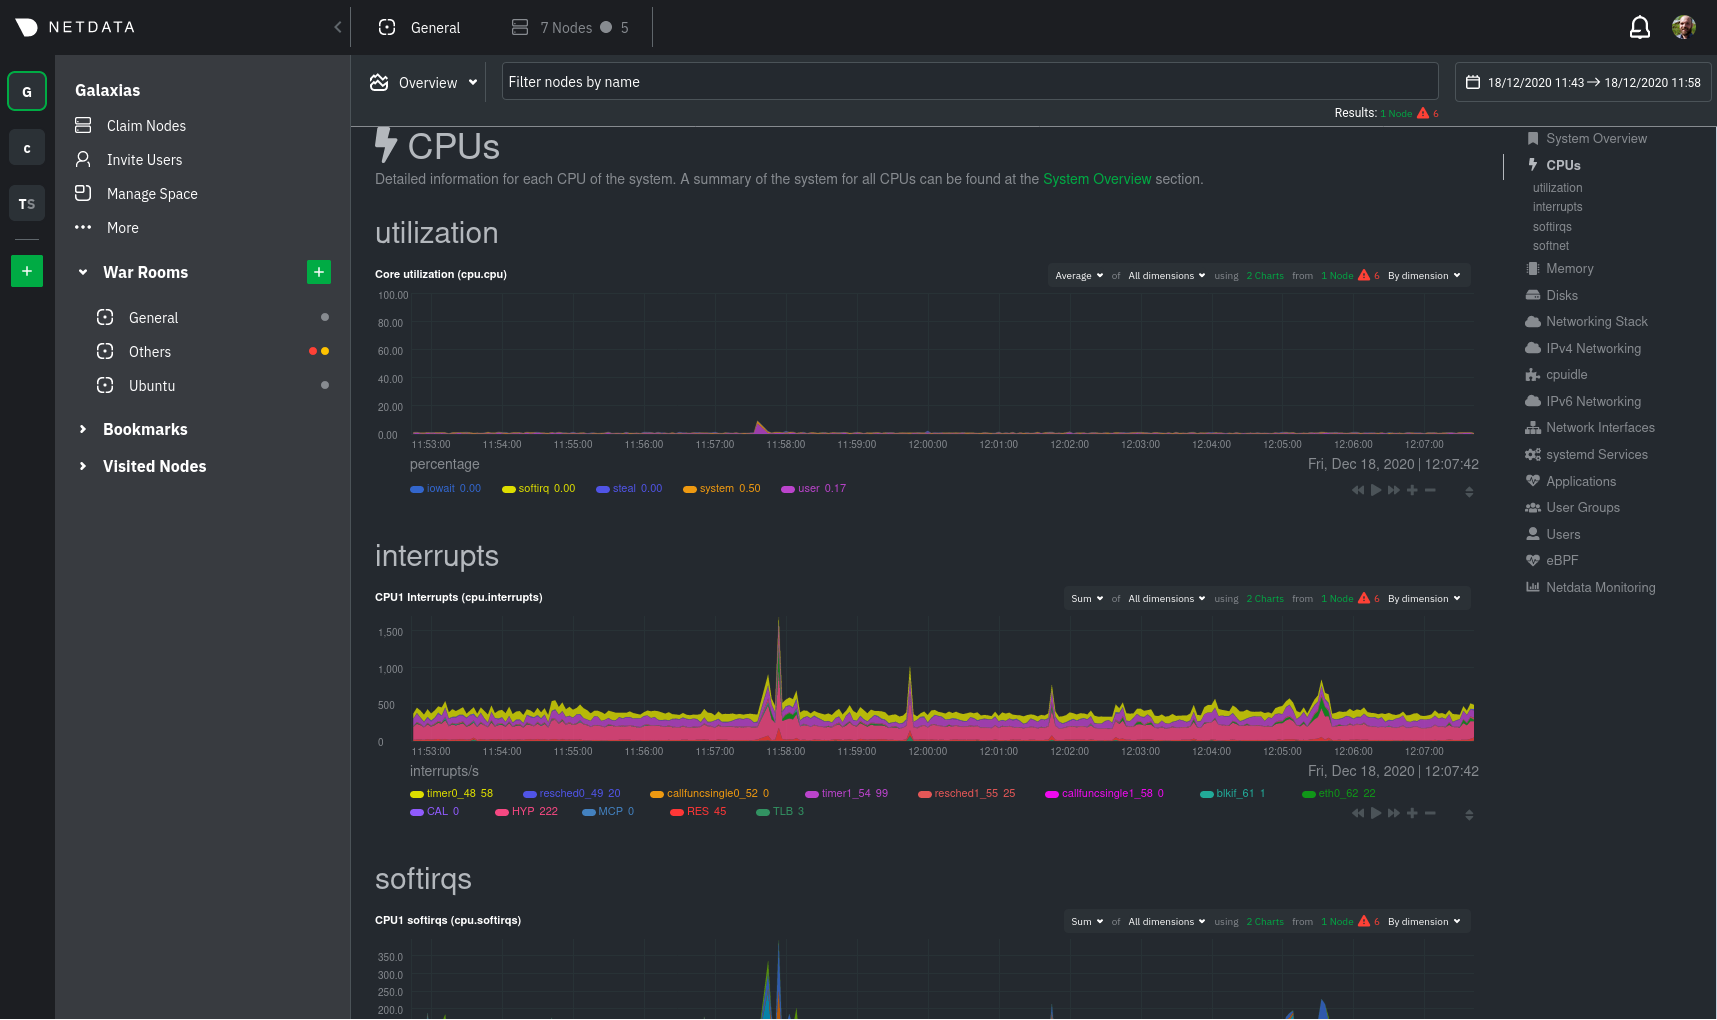 You can use these features together or separately—the decision is up to you and the needs of your infrastructure. **What's next?**: -- Read about the [Agent-Cloud integration](). -- Get an overview of Cloud's features by reading [Cloud documentation](https://learn.netdata.cloud/docs/cloud/). -- Follow the 5-minute [get started with Cloud](https://learn.netdata.cloud/docs/cloud/get-started/) guide to finish - onboarding and claim your first nodes. -- Better understand how agents connect securely to the Cloud with [claiming](/claim/README.md) and [Agent-Cloud - link](/aclk/README.md) documentation. +- Sign up for [Netdata Cloud](https://app.netdata.cloud). +- Read the [infrastructure monitoring quickstart](/docs/quickstart/infrastructure.md). +- Better understand how the Netdata Agent connects securely to Netdata Cloud with [claiming](/claim/README.md) and + [Agent-Cloud link](/aclk/README.md) documentation. ## Start, stop, and restart Netdata diff --git a/docs/guides/configure/performance.md b/docs/guides/configure/performance.md index 24231fb81b..e542736a1d 100644 --- a/docs/guides/configure/performance.md +++ b/docs/guides/configure/performance.md @@ -52,7 +52,7 @@ Let's walk through the best ways to improve the Netdata Agent's performance. The fastest way to improve the Agent's resource utilization is to reduce how often it collects metrics. -## Global +### Global If you don't need per-second metrics, or if the Netdata Agent uses a lot of CPU even when no one is viewing that node's dashboard, configure the Agent to collect metrics less often. @@ -69,18 +69,13 @@ seconds, respectively. update every: 5 ``` +### Specific plugin or collector + Every collector and plugin has its own `update every` setting, which you can also change in the `go.d.conf`, `python.d.conf`, `node.d.conf`, or `charts.d.conf` files, or in individual collector configuration files. If the `update every` for an individual collector is less than the global, the Netdata Agent uses the global setting. See the [enable or configure a collector](/docs/collect/enable-configure.md) doc for details. -## Specific plugin or collector - -If you did not [reduce the global collection frequency](#global) but find that a specific plugin/collector uses too many -resources, you can reduce its frequency. You configure [internal -collectors](/docs/collect/how-collectors-work.md#collector-architecture-and-terminolog) in `netdata.conf` and external -collectors in their individual `.conf` files. - To reduce the frequency of an [internal plugin/collector](/docs/collect/how-collectors-work.md#collector-architecture-and-terminology), open `netdata.conf` and find the appropriate section. For example, to reduce the frequency of the `apps` plugin, which collects and visualizes diff --git a/docs/monitor/configure-alarms.md b/docs/monitor/configure-alarms.md index 4575b03ea1..2a977955b8 100644 --- a/docs/monitor/configure-alarms.md +++ b/docs/monitor/configure-alarms.md @@ -22,7 +22,8 @@ files. ## Edit health configuration files All of Netdata's [health configuration files](/health/REFERENCE.md#health-configuration-files) are in Netdata's config -directory, inside the `health.d/` directory. Use Netdata's `edit-config` script to make changes to any of these files. +directory, inside the `health.d/` directory. Navigate to your [Netdata config directory](/docs/configure/nodes.md) and +use `edit-config` to make changes to any of these files. For example, to edit the `cpu.conf` health configuration file, run: @@ -75,13 +76,18 @@ your systems, containers, and applications work. Read Netdata's [health reference](/health/REFERENCE.md#health-entity-reference) for a full listing of the format, syntax, and functionality of health entities. -To write a new health entity, use `edit-config` to create a new file inside of the `health.d/` directory. +To write a new health entity into a new file, navigate to your [Netdata config directory](/docs/configure/nodes.md), +then use `touch` to create a new file in the `health.d/` directory. Use `edit-config` to start editing the file. + +As an example, let's create a `ram-usage.conf` file. ```bash -sudo ./edit-config health.d/example.conf +sudo touch health.d/ram-usage.conf +sudo ./edit-config health.d/ram-usage.conf ``` -For example, here is a health entity that triggers an alarm when a node's RAM usage rises above 80%: +For example, here is a health entity that triggers a warning alarm when a node's RAM usage rises above 80%, and a +critical alarm above 90%: ```yaml alarm: ram_usage diff --git a/docs/quickstart/infrastructure.md b/docs/quickstart/infrastructure.md index aa89d7a533..0e355f373e 100644 --- a/docs/quickstart/infrastructure.md +++ b/docs/quickstart/infrastructure.md @@ -76,7 +76,7 @@ Overview features composite charts, which display aggregated metrics from every are streamed on-demand from individual nodes and composited onto a single, familiar dashboard. 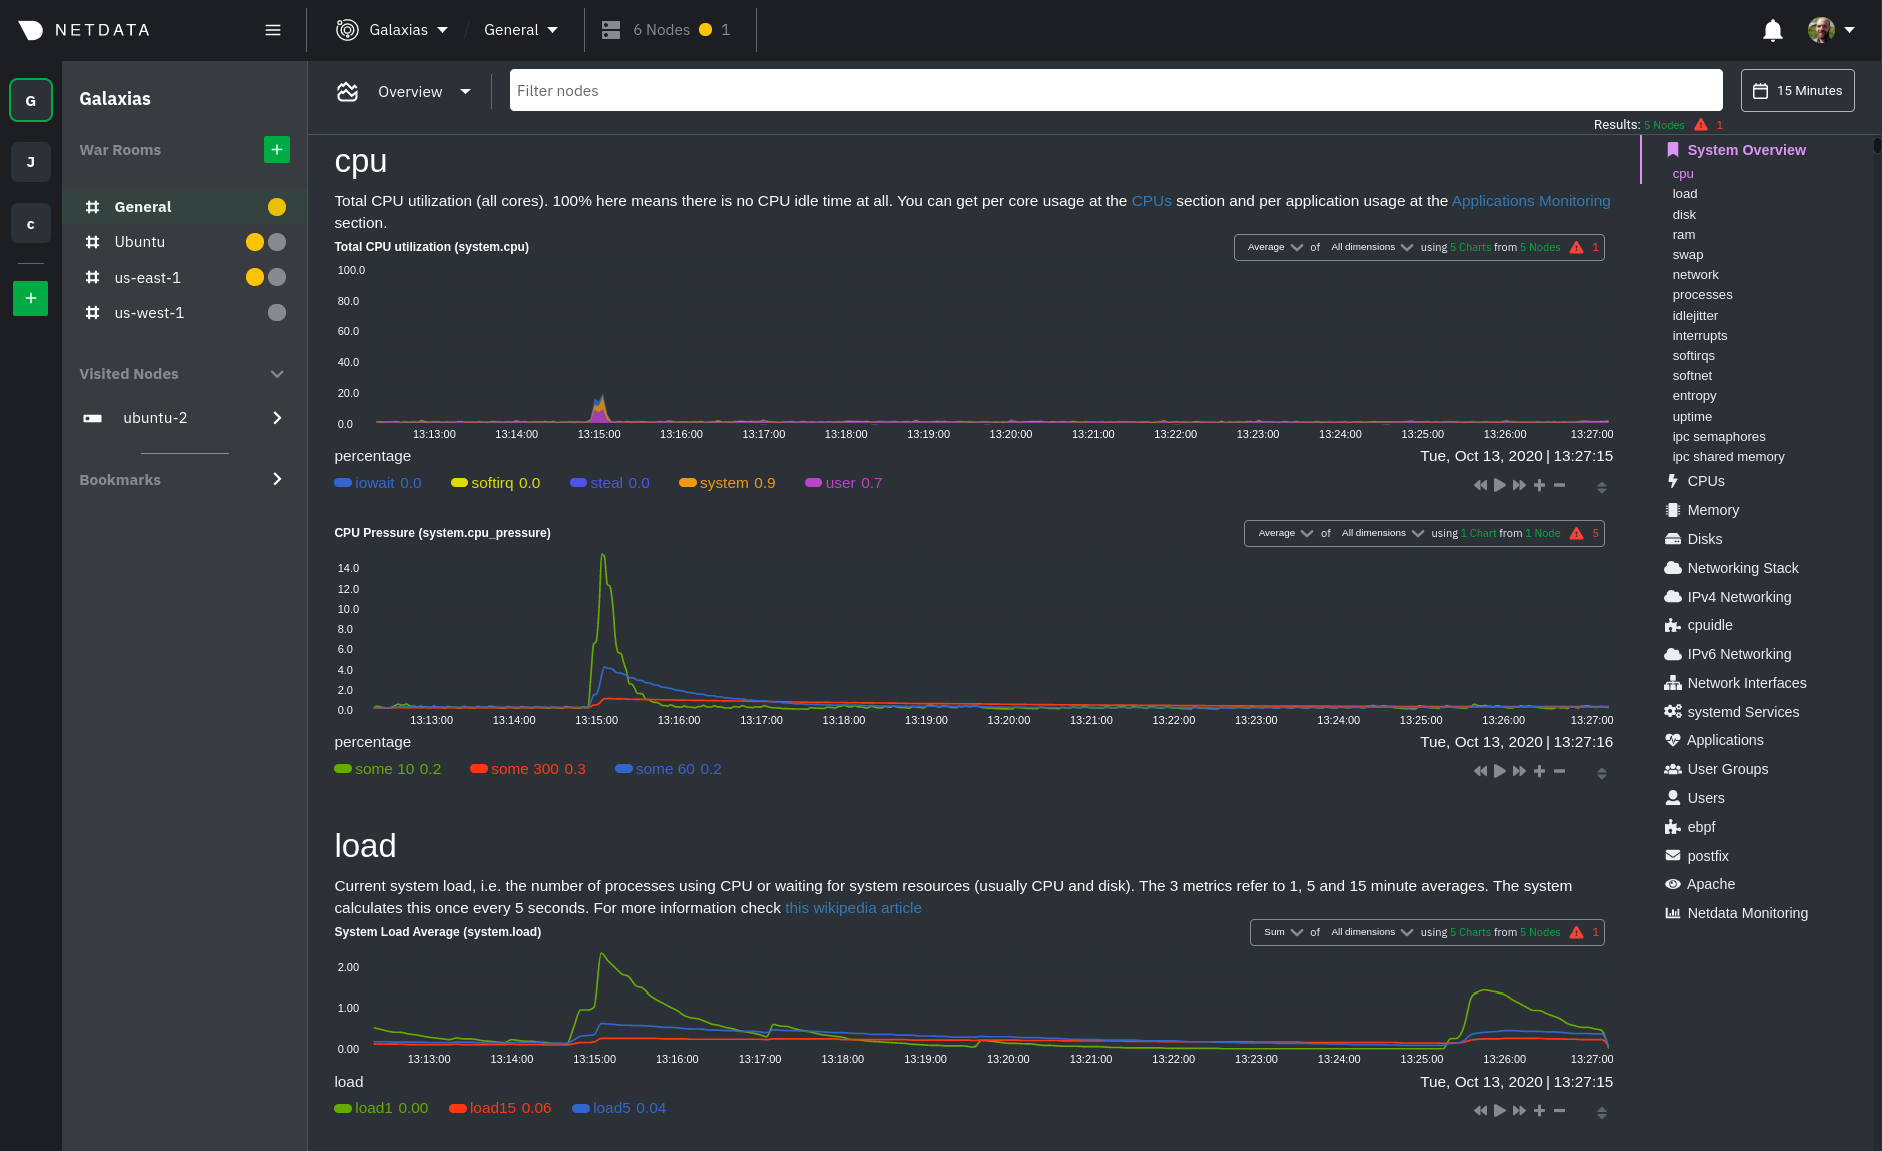 +Overview](https://user-images.githubusercontent.com/1153921/102651377-b1f4b100-4129-11eb-8e60-d2995d258c16.png) Read more about the Overview in the [infrastructure overview](/docs/visualize/overview-infrastructure.md) doc. diff --git a/docs/visualize/create-dashboards.md b/docs/visualize/create-dashboards.md index d4bcf71c1f..91a8dccccc 100644 --- a/docs/visualize/create-dashboards.md +++ b/docs/visualize/create-dashboards.md @@ -14,12 +14,14 @@ In the War Room you want to monitor with this dashboard, click on your War Room' Add** button next to **Dashboards**. In the panel, give your new dashboard a name, and click **+ Add**. Click the **Add Chart** button to add your first chart card. From the dropdown, select the node you want to add the -chart from, then the context. Netdata Cloud shows you a preview of the chart before you finish adding it. The **Add -Text** button creates a new card with user-defined text, which you can use to describe or document a particular -dashboard's meaning and purpose. +chart from, then the context. Netdata Cloud shows you a preview of the chart before you finish adding it. -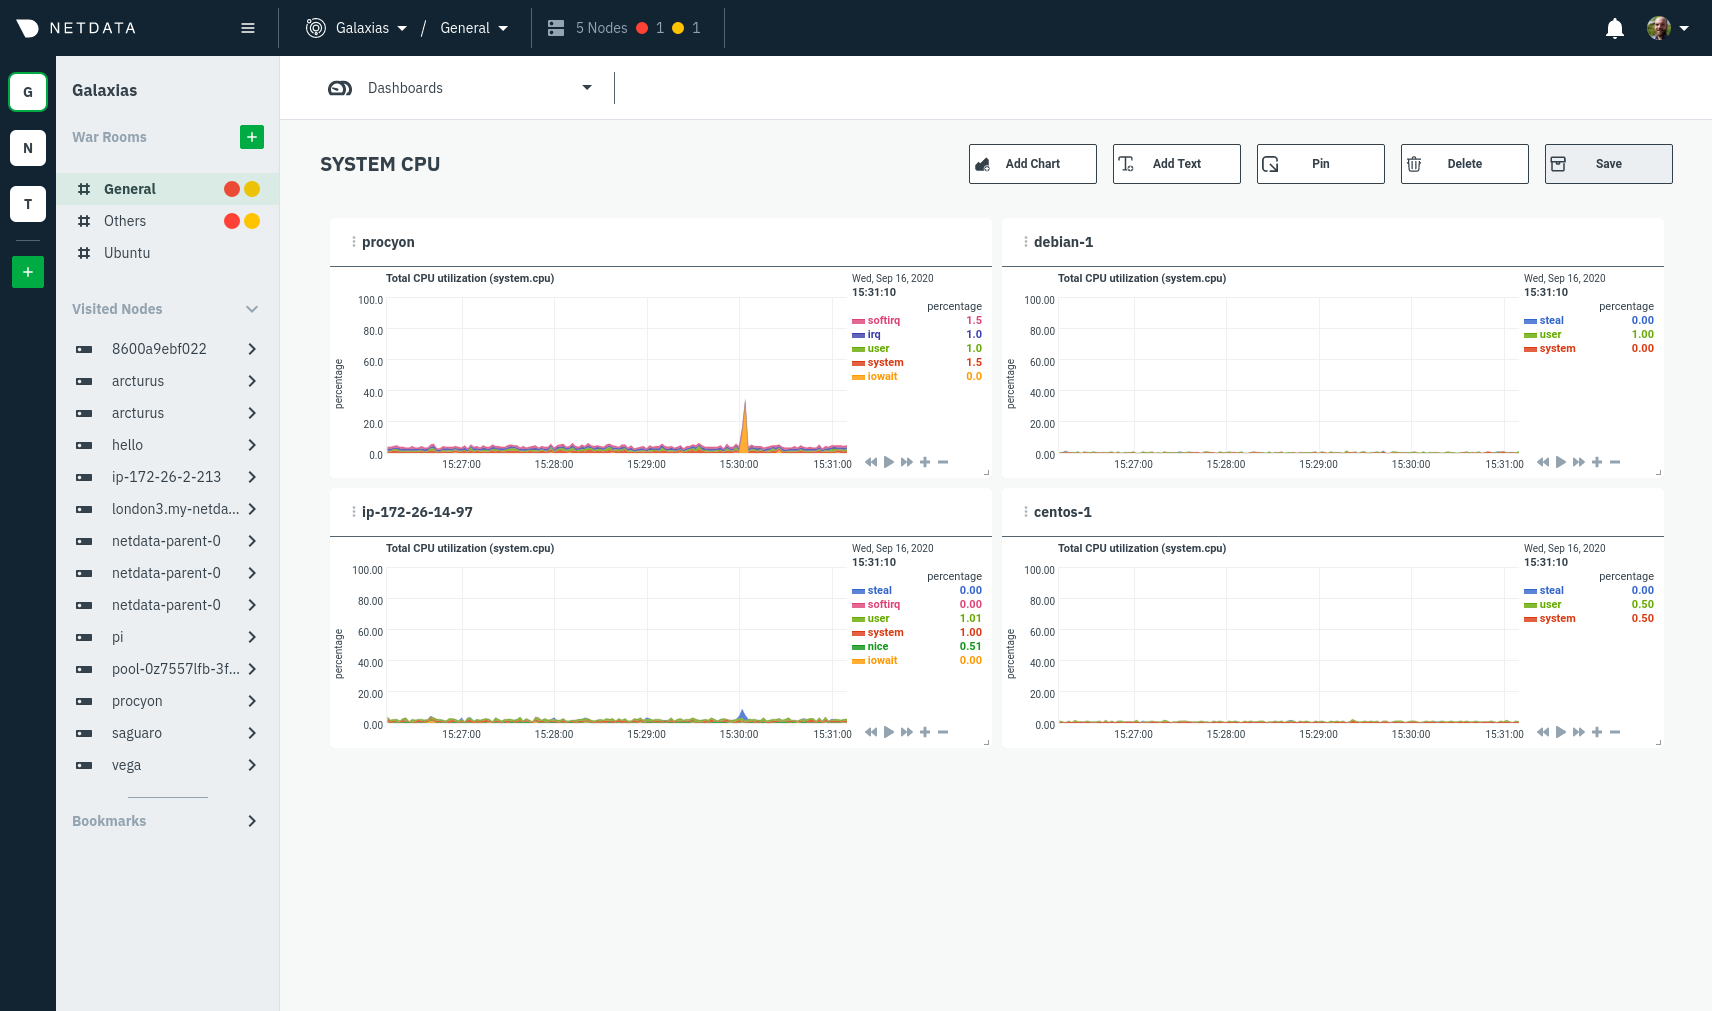 +The **Add Text** button creates a new card with user-defined text, which you can use to describe or document a +particular dashboard's meaning and purpose. Enrich the dashboards you create with documentation or procedures on how to +respond + +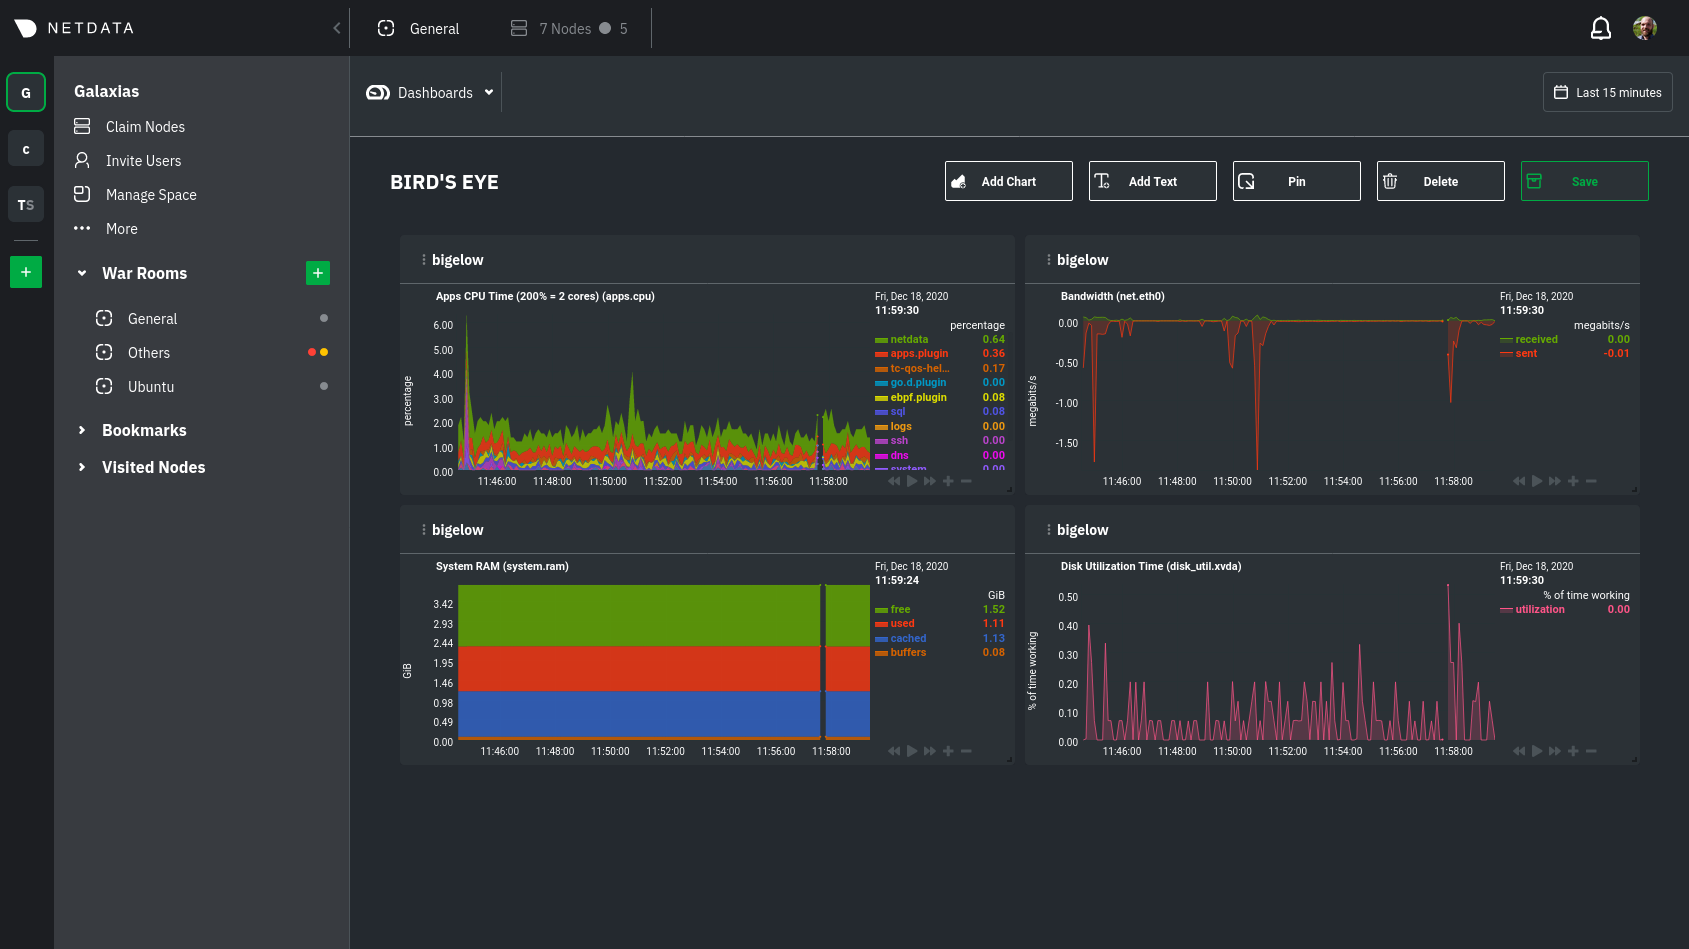 Charts in dashboards are [fully interactive](/docs/visualize/interact-dashboards-charts.md) and synchronized. You can pan through time, zoom, highlight specific timeframes, and more. @@ -41,7 +43,8 @@ complex performance problems. When viewing a single-node Cloud dashboard, you can also click on the add to dashboard icon <img src="https://user-images.githubusercontent.com/1153921/87587846-827fdb00-c697-11ea-9f31-aed0b8c6afba.png" alt="Dashboard -icon" class="image-inline" /> to quickly add that chart to a new or existing dashboard. You might find this useful when investigating an anomaly and want to quickly populate a dashboard with potentially correlated metrics. +icon" class="image-inline" /> to quickly add that chart to a new or existing dashboard. You might find this useful when +investigating an anomaly and want to quickly populate a dashboard with potentially correlated metrics. ## Pin dashboards and navigate through Netdata Cloud @@ -49,8 +52,6 @@ Click on the **Pin** button in any dashboard to put those charts into a separate can now navigate through Netdata Cloud freely, individual Cloud dashboards, the Nodes view, different War Rooms, or even different Spaces, and have those valuable metrics follow you. - - Pinning dashboards helps you correlate potentially related charts across your infrastructure and discover root causes faster. diff --git a/docs/visualize/interact-dashboards-charts.md b/docs/visualize/interact-dashboards-charts.md index dd1d10a9af..30503c2202 100644 --- a/docs/visualize/interact-dashboards-charts.md +++ b/docs/visualize/interact-dashboards-charts.md @@ -83,8 +83,8 @@ Whenever you use a chart in this way, Netdata synchronizes all the other charts | **Zoom** to a specific timeframe | `SHIFT` + `mouse selection` | | | | **Zoom** in/out | `SHIFT`/`ALT` + `mouse scrollwheel` | `SHIFT`/`ALT` + `two-finger pinch` (touchpad/touchscreen) | `SHIFT`/`ALT` + `two-finger scroll` (touchpad/touchscreen) | - + These interactions can also be triggered using the icons on the bottom-right corner of every chart. They are, respectively, `Pan Left`, `Reset`, `Pan Right`, `Zoom In`, and `Zoom Out`. @@ -97,7 +97,7 @@ You can resize any chart by clicking-and-dragging the icon on the bottom-right c to its original height, double-click the same icon.  +height](https://user-images.githubusercontent.com/1153921/102652691-24b25c00-412b-11eb-9e2c-95325fcedc67.gif) ### Composite charts in Netdata Cloud diff --git a/docs/visualize/overview-infrastructure.md b/docs/visualize/overview-infrastructure.md index 63a0bad7fb..675abd745b 100644 --- a/docs/visualize/overview-infrastructure.md +++ b/docs/visualize/overview-infrastructure.md @@ -15,7 +15,7 @@ anomalies, then drill down with filtering or single-node dashboards to see more. each chart visualizes average or sum metrics values from across 5 distributed nodes.  +Overview](https://user-images.githubusercontent.com/1153921/102651377-b1f4b100-4129-11eb-8e60-d2995d258c16.png) ## Using the Overview diff --git a/exporting/README.md b/exporting/README.md index 8f490cc2ff..d10ea32aa8 100644 --- a/exporting/README.md +++ b/exporting/README.md @@ -17,6 +17,9 @@ databases](/docs/export/external-databases.md), or jump in to [enabling a connec The exporting engine has a modular structure and supports metric exporting via multiple exporting connector instances at the same time. You can have different update intervals and filters configured for every exporting connector instance. +When you enable the exporting engine and a connector, the Netdata Agent exports metrics _beginning from the time you +restart its process_, not the entire [database of long-term metrics](/docs/store/change-metrics-storage.md). + The exporting engine has its own configuration file `exporting.conf`. The configuration is almost similar to the deprecated [backends](/backends/README.md#configuration) system. The most important difference is that type of a connector should be specified in a section name before a colon and an instance name after the colon. Also, you can't use |