
diff options
| author | Joel Hans <joel@netdata.cloud> | 2020-12-15 07:31:31 -0700 |
|---|---|---|
| committer | GitHub <noreply@github.com> | 2020-12-15 07:31:31 -0700 |
| commit | 50e8edabaa2f02c3345ce3eff9d45a85c51d5fb2 (patch) | |
| tree | 90acc6ff655cf6777824a1e67e74006550a5a227 | |
| parent | 2f90dabed67801d61b33fae12494ac055a78d398 (diff) | |
Add documentation for time & date picker in Agent and Cloud (#10347)
* Add new documentation for time & date pickers
* Update GIFs
* GIF in main README
* Fixes for Amy and Odysseas
| -rw-r--r-- | README.md | 2 | ||||
| -rw-r--r-- | docs/visualize/interact-dashboards-charts.md | 30 | ||||
| -rw-r--r-- | web/README.md | 16 | ||||
| -rw-r--r-- | web/gui/README.md | 85 |
4 files changed, 84 insertions, 49 deletions
@@ -55,7 +55,7 @@ Netdata](https://user-images.githubusercontent.com/1153921/96495792-2e881380-11f ## Features  +action](https://user-images.githubusercontent.com/1153921/101513938-fae28380-3939-11eb-9434-8ad86a39be62.gif) Here's what you can expect from Netdata: diff --git a/docs/visualize/interact-dashboards-charts.md b/docs/visualize/interact-dashboards-charts.md index d9a3ef6b8b..dd1d10a9af 100644 --- a/docs/visualize/interact-dashboards-charts.md +++ b/docs/visualize/interact-dashboards-charts.md @@ -13,9 +13,6 @@ metrics, and you interact with both of them the same way. > If you're not sure which option is best for you, see our [single-node](/docs/quickstart/single-node.md) and > [infrastructure](/docs/quickstart/infrastructure.md) quickstart guides. - - Netdata dashboards are single, scrollable pages with many charts stacked on top of one another. As you scroll up or down, charts appearing in your browser's viewport automatically load and update every second. @@ -24,6 +21,31 @@ automatically generated based on which [collectors](/docs/collect/how-collectors Netdata starts up. Sections also appear in the right-hand **menu**, along with submenus based on the contexts and families Netdata creates for your node. +## Choose timeframes to visualize + +Both the local Agent dashboard and Netdata Cloud feature time & date pickers to help you visualize specific points in +time. In Netdata Cloud, the picker appears in the [Overview](/docs/visualize/overview-infrastructure.md), [Nodes +view](https://learn.netdata.cloud/docs/cloud/visualize/nodes), [new +dashboards](https://learn.netdata.cloud/docs/cloud/visualize/dashboards), and any single-node dashboards you visit. + +Local Agent dashboard: + +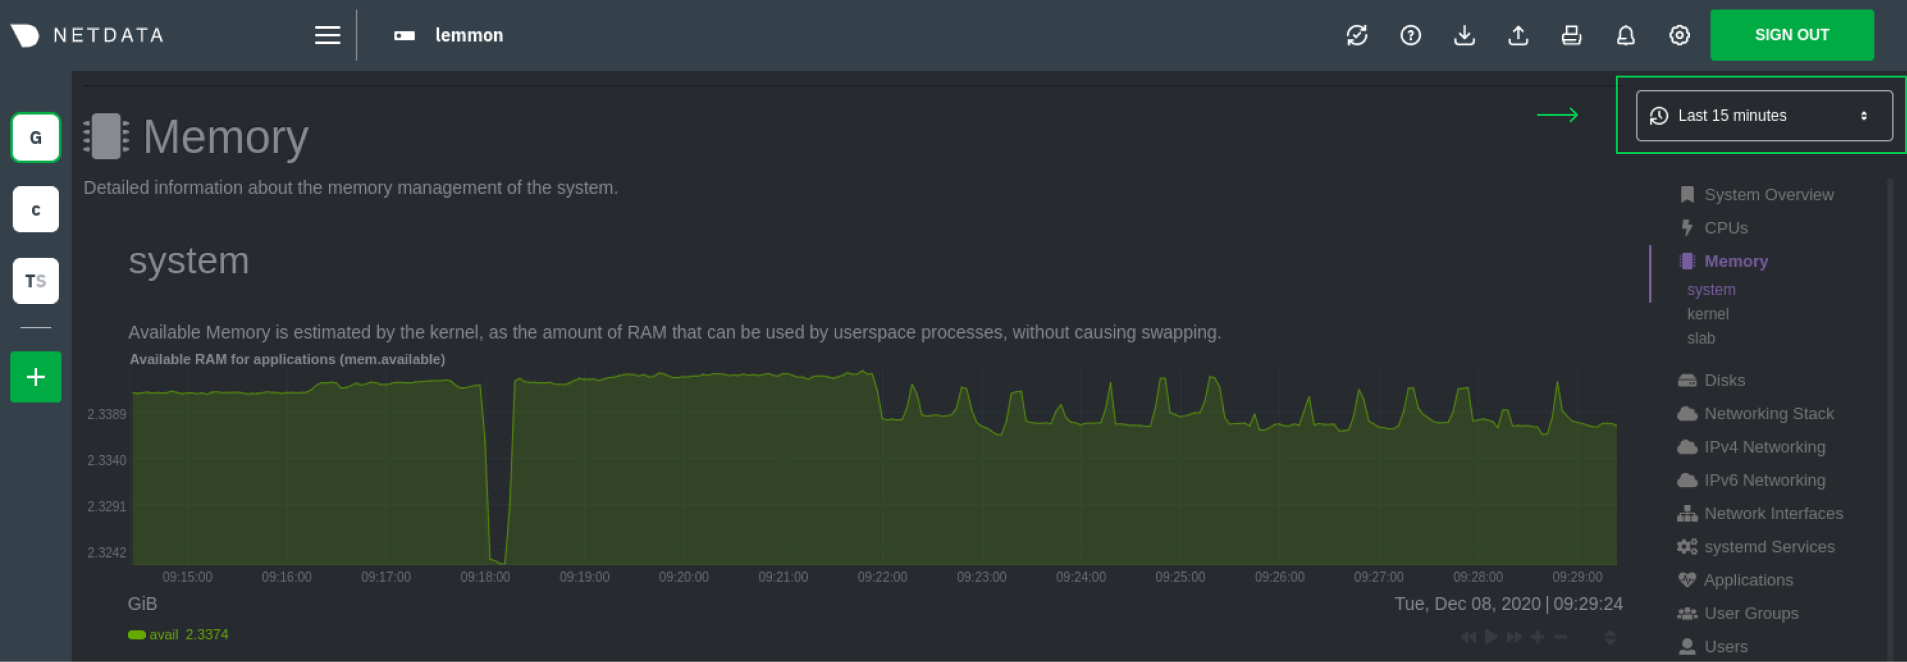 + +Netdata Cloud: + +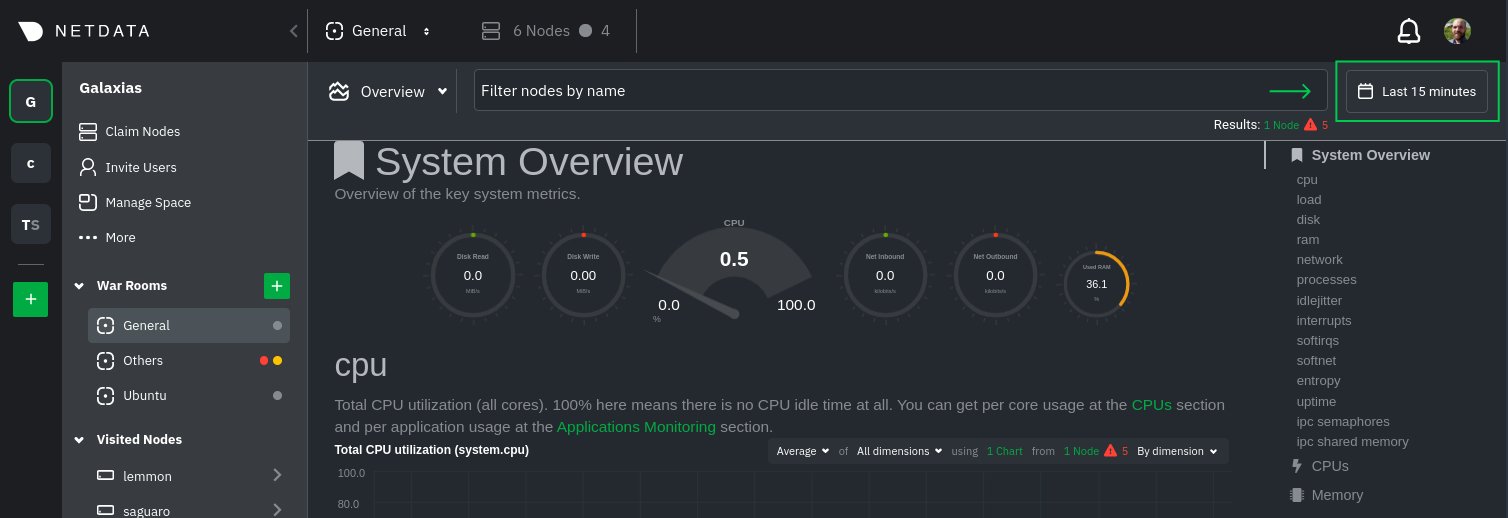 + +Their behavior is identical. Use the Quick Selector to visualize generic timeframes, or use the calendar or inputs to +select days, hours, minutes or seconds. Click **Apply** to re-render all visualizations with new metrics data, or +**Clear** to restore the default timeframe. + +See reference documentation for the [local Agent dashboard](/web/gui/README.md#time--date-picker) and [Netdata +Cloud](https://learn.netdata.cloud/docs/cloud/war-rooms#time--date-picker) for additional context about how the time & +date picker behaves in each environment. + ## Charts, dimensions, families, and contexts A **chart** is an interactive visualization of one or more collected/calculated metrics. You can see the name (also @@ -99,5 +121,7 @@ to get informed when something goes wrong in your infrastructure. - [Netdata Agent · Web dashboards overview](/web/README.md) - [Netdata Cloud · War Rooms](https://learn.netdata.cloud/docs/cloud/war-rooms) - [Netdata Cloud · Overview](https://learn.netdata.cloud/docs/cloud/visualize/overview) +- [Netdata Cloud · Nodes](https://learn.netdata.cloud/docs/cloud/visualize/nodes) +- [Netdata Cloud · Build new dashboards](https://learn.netdata.cloud/docs/cloud/visualize/dashboards) [](<>) diff --git a/web/README.md b/web/README.md index 1970e97204..fc1d37170d 100644 --- a/web/README.md +++ b/web/README.md @@ -1,6 +1,6 @@ <!-- title: "Dashboards" -description: "Netdata comes bundled with hundreds of real-time, context-aware charts that help your monitor health and performance without configuration." +description: "Every Netdata Agent comes bundled with hundreds of interactive, customizable charts designed by monitoring and troubleshooting experts." custom_edit_url: https://github.com/netdata/netdata/edit/master/web/README.md --> @@ -14,11 +14,10 @@ team and the community, but you can also customize them yourself. There are two primary ways to view Netdata's dashboards: -1. The [standard web dashboard](/web/gui/README.md) that comes pre-configured with every - Netdata installation. You can see it at `http://SERVER-IP:19999`, or - `http://localhost:19999` on `localhost`. You can customize the contents and - colors of the standard dashboard [using - JavaScript](/web/gui/README.md#customizing-the-standard-dashboard). +1. The [local Agent dashboard](/web/gui/README.md) that comes pre-configured with every Netdata installation. You can + see it at `http://NODE:19999`, replacing `NODE` with `localhost`, the hostname of your node, or its IP address. You + can customize the contents and colors of the standard dashboard [using + JavaScript](/web/gui/README.md#customizing-the-standard-dashboard). 2. The [`dashboard.js` JavaScript library](#dashboardjs), which helps you [customize the standard dashboards](/web/gui/README.md#customizing-the-standard-dashboard) @@ -27,9 +26,8 @@ There are two primary ways to view Netdata's dashboards: You can also view all the data Netdata collects through the [REST API v1](/web/api/). -No matter where you use Netdata's charts, you'll want to know how to -[use](#using-charts) them. You'll also want to understand how Netdata defines -[charts](#charts), [dimensions](#dimensions), [families](#families), and +No matter where you use Netdata's charts, you'll want to know how to [use](#using-charts) them. You'll also want to +understand how Netdata defines [charts](#charts), [dimensions](#dimensions), [families](#families), and [contexts](#contexts). ## Using charts diff --git a/web/gui/README.md b/web/gui/README.md index 8e541164bd..c13f3d6cbc 100644 --- a/web/gui/README.md +++ b/web/gui/README.md @@ -1,47 +1,40 @@ <!-- ---- -title: "The standard web dashboard" -date: 2020-05-04 +title: "Local Agent dashboard" +description: "The local Netdata Agent dashboard is the heart of health monitoring and performance troubleshooting, with hundreds of real-time charts." custom_edit_url: https://github.com/netdata/netdata/edit/master/web/gui/README.md ---- --> -# The standard web dashboard +# Local Agent dashboard -The standard web dashboard is the heart of Netdata's performance troubleshooting toolkit. You've probably seen it +The local Netdata Agent dashboard is the heart of Netdata's performance troubleshooting toolkit. You've probably seen it before:  +action](https://user-images.githubusercontent.com/1153921/101513938-fae28380-3939-11eb-9434-8ad86a39be62.gif) -Learn more about how dashboards work and how they're populated using the -`dashboards.js` file in our [web dashboards overview](/web/README.md). +Learn more about how dashboards work and how they're populated using the `dashboards.js` file in our [web dashboards +overview](/web/README.md). By default, Netdata starts a web server for its dashboard at port `19999`. Open up your web browser of choice and navigate to `http://NODE:19999`, replacing `NODE` with the IP address or hostname of your Agent. If you're unsure, try `http://localhost:19999` first. -> In v1.21 of the Agent, we replaced the legacy dashboard with a refactored dashboard written in React. By using React, -> we simplify our code and give our engineers better tools to add new features and fix bugs. The only UI change with -> this dashboard is the top navigation and left-hand navigation for [Cloud integration](/docs/agent-cloud.md). The old -> dashboard is still accessible at the `http://NODE:19999/old` subfolder. +Netdata uses an [internal, static-threaded web server](/web/server/README.md) to host the HTML, CSS, and JavaScript +files that make up the local Agent dashboard. You don't have to configure anything to access it, although you can adjust +[your settings](/web/server/README.md#other-netdataconf-web-section-options) in the `netdata.conf` file, or run Netdata +behind an [Nginx proxy](https://learn.netdata.cloud/docs/agent/running-behind-nginx), and so on. -Netdata uses an [internal, static-threaded web server](/web/server/README.md) to host the -HTML, CSS, and JavaScript files that make up the standard dashboard. You don't -have to configure anything to access it, although you can adjust [your -settings](/web/server/README.md#other-netdataconf-web-section-options) in the -`netdata.conf` file, or run Netdata behind an Nginx proxy, and so on. +## Navigating the local dashboard -## Navigating the standard dashboard - -Beyond charts, the standard dashboard can be broken down into three key areas: +Beyond charts, the local dashboard can be broken down into three key areas: 1. [**Sections**](#sections) -2. [**Metrics menus/submenus**](#metrics-menus) -3. [**Cloud menus: Spaces, War Rooms, and Visited nodes)**](#cloud-menus-spaces-war-rooms-and-visited-nodes) +2. [**Time & date picker](#time--date-picker) +3. [**Metrics menus/submenus**](#metrics-menus) +4. [**Netdata Cloud menus: Spaces, War Rooms, and Visited nodes)**](#cloud-menus-spaces-war-rooms-and-visited-nodes) - +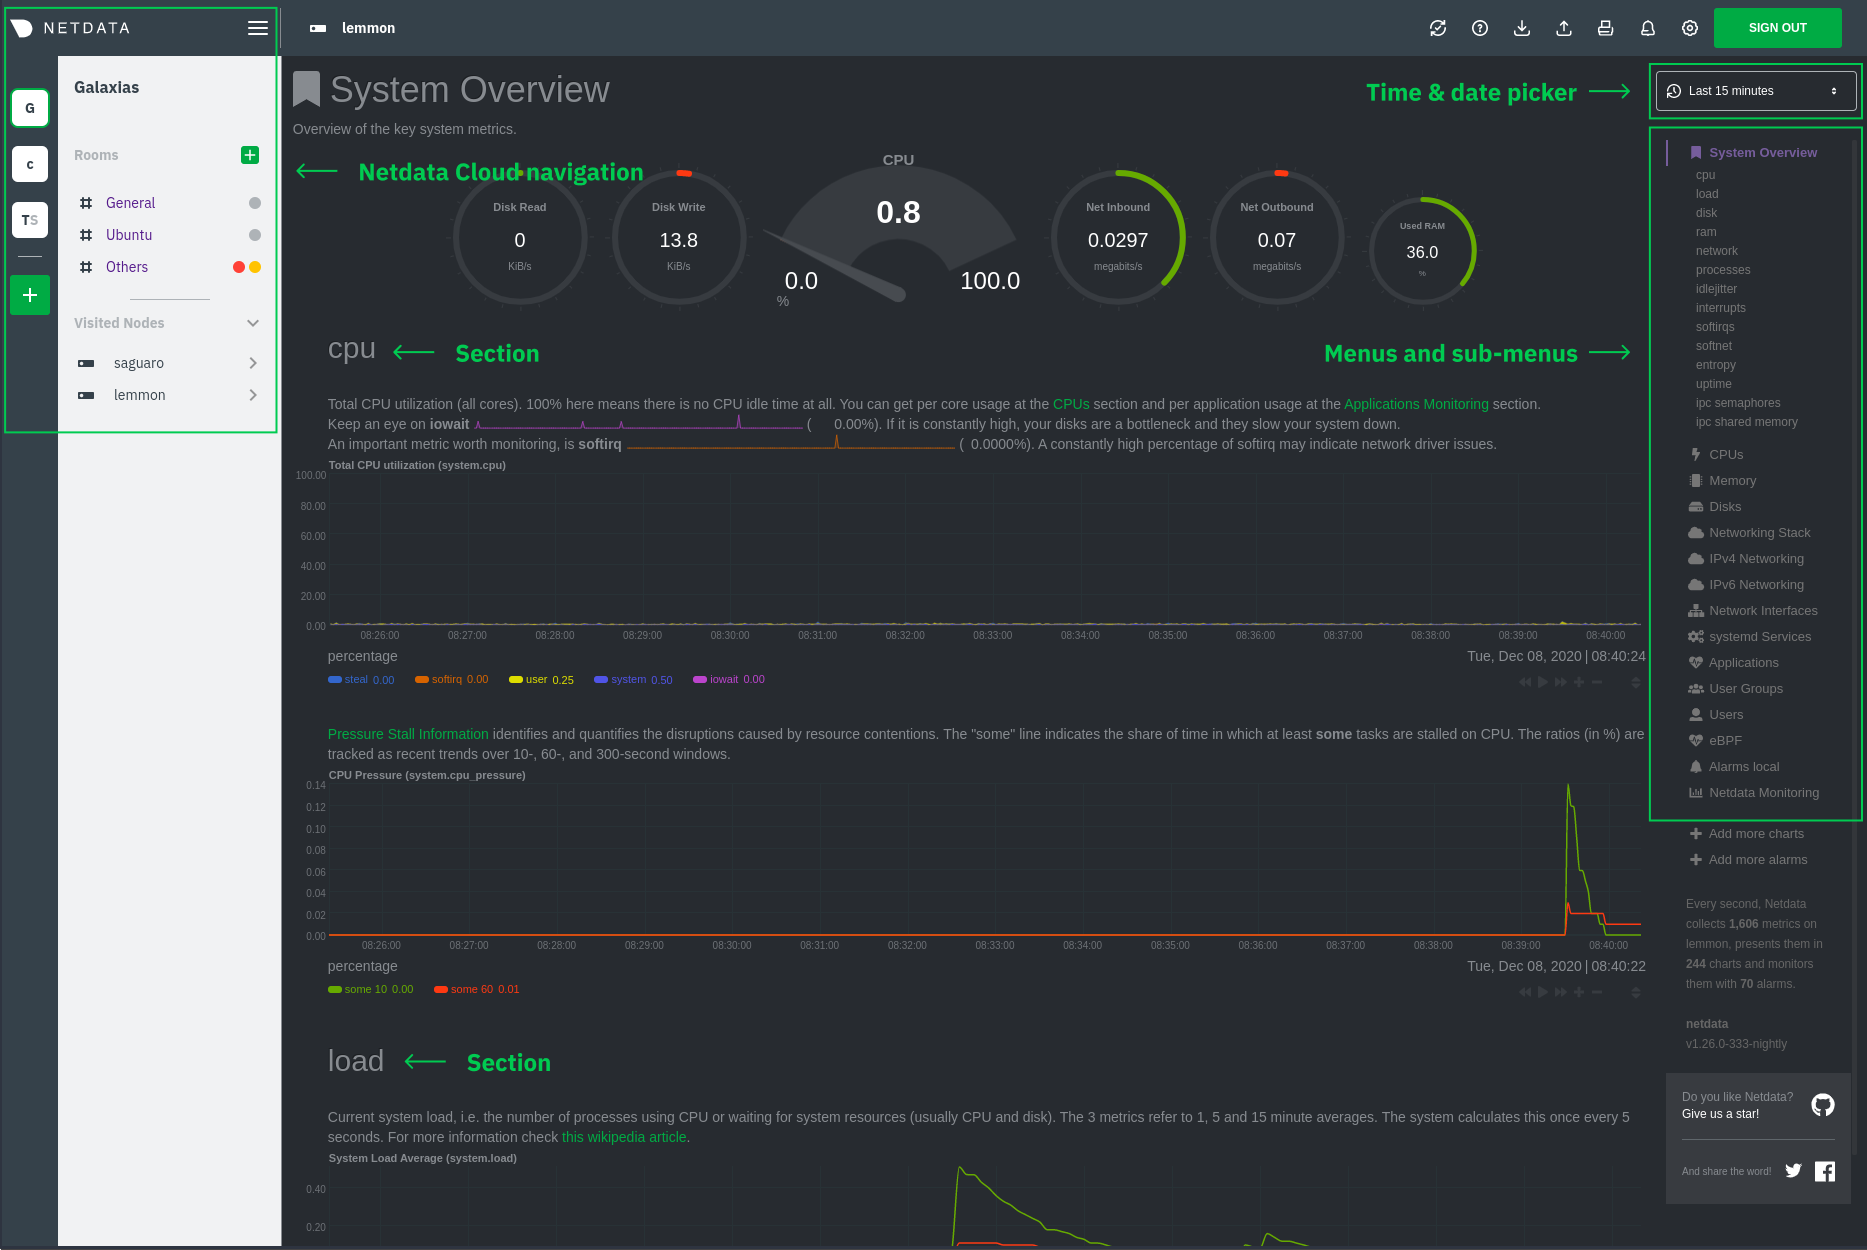 ### Sections @@ -53,16 +46,36 @@ broken down into [contexts](/web/README.md#contexts) and An example of the **Memory** section on a Linux desktop system.  +dashboard](https://user-images.githubusercontent.com/1153921/101508423-e354cc00-3934-11eb-9b33-3ad57a5988b4.png) + +All sections and their associated charts appear on a single page, so all you need to do to view different sections is +scroll up and down. But it's usually quicker to use the [menus](#metrics-menus). + +### Time & date picker + +The local dashboard features a time & date picker to help you visualize specific timeframes of historical metrics. The +picker chooses an appropriate default to always show per-second granularity based on the width of your browser's +viewport. + +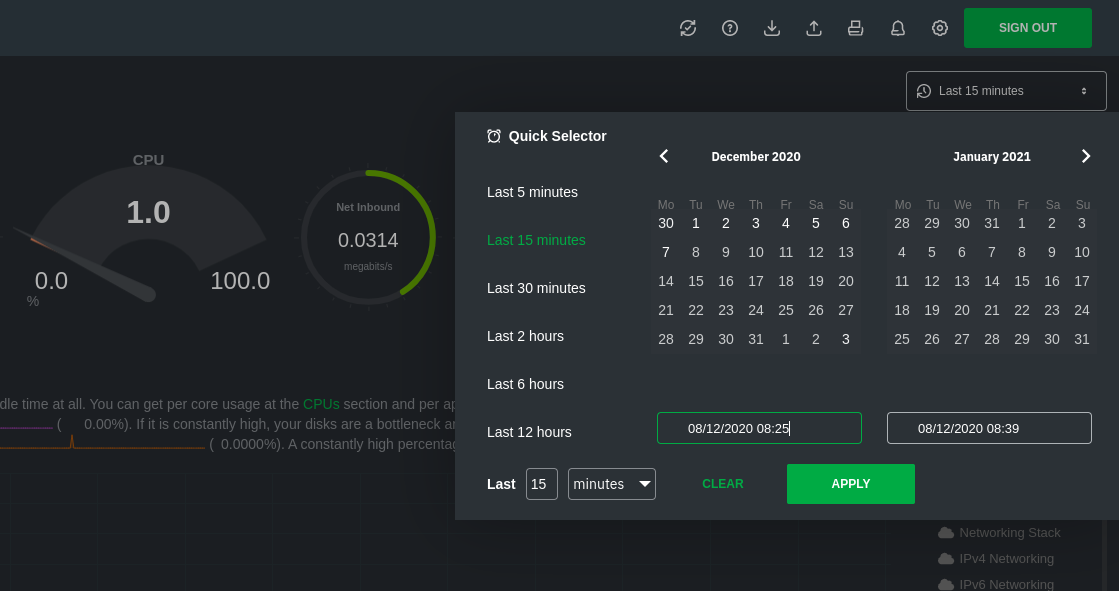 + +Use the Quick Selector to show metrics from the last 5 minutes, 15 minutes, 30 minutes, 2 hours, 6 hours, or 12 hours. + +Beneath the Quick Selector is an input field and dropdown you use in combination to select a specific timeframe of +minutes, hours, days, or months. Enter a number and choose the appropriate unit of time. + +Use the calendar to select multiple days. Click on a date to begin the timeframe selection, then an ending date. + +Click **Apply** to re-render all visualizations with new metrics data, or **Clear** to restore the default timeframe. -All sections and their associated charts appear on a single "page," so all you -need to do to view different sections is scroll up and down the page. But it's -usually quicker to use the [menus](#metrics-menus). +[Increase the metrics retention policy](/docs/store/change-metrics-storage.md) for your node to see more historical +timeframes. ### Metrics menus -**Metrics menus** appears on the right-hand side of the standard dashboard. Netdata generates a menu for each section, -and menus link to the section they're associated with. +**Metrics menus** appears on the right-hand side of the local Agent dashboard. Netdata generates a menu for each +section, and menus link to the section they're associated with. 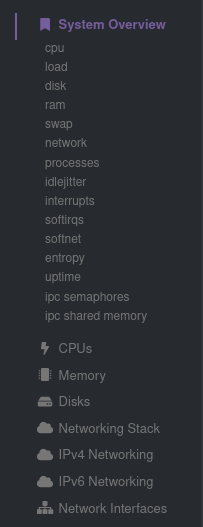 @@ -78,10 +91,10 @@ submenus](https://user-images.githubusercontent.com/1153921/80834697-11577e00-8b ### Cloud menus (Spaces, War Rooms, and Visited nodes) -The dashboard also features a menu related to Cloud functionality. You can view your existing Spaces or create new ones -via the vertical column of boxes. This menu also displays the name of your current Space, shows a list of any War Rooms -you've added you your Space, and lists your Visited nodes. If you click on a War Room's name, the dashboard redirects -you to the Netdata Cloud web interface. +The dashboard also features a menu related to Netdata Cloud functionality. You can view your existing Spaces or create +new ones via the left vertical column of boxes. This menu also displays the name of your current Space, shows a list of +any War Rooms you've added you your Space, and lists any notes you recently visited via their Agent dashboards. Click on +a War Room's name to jump to the Netdata Cloud web interface. 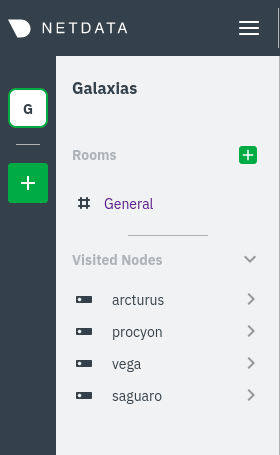 @@ -89,7 +102,7 @@ menus](https://user-images.githubusercontent.com/1153921/80837210-3f8b8c80-8bab- If you want to know more about how Cloud populates this menu, and the Agent-Cloud integration at a high level, see our document on [using the Agent with Netdata Cloud](/docs/agent-cloud.md). -## Customizing the standard dashboard +## Customizing the local dashboard Netdata stores information about individual charts in the `dashboard_info.js` file. This file includes section and subsection headings, descriptions, colors, |