
diff options
| author | Fotis Voutsas <fotis@netdata.cloud> | 2024-04-26 14:24:48 +0300 |
|---|---|---|
| committer | Fotis Voutsas <fotis@netdata.cloud> | 2024-04-26 14:24:48 +0300 |
| commit | 454c27bb777355310daa86bd0e903b95b67f7abb (patch) | |
| tree | 03f72a4dedd67469fd3ac07c075338f19f7ff222 | |
| parent | 700efa5419fc3ea52aea117286b8bb29e2be20b9 (diff) | |
refresh the ML documentation and consolidate the two docs
| -rw-r--r-- | src/ml/README.md | 302 |
1 files changed, 72 insertions, 230 deletions
diff --git a/src/ml/README.md b/src/ml/README.md index 6ec6fcb5bc..e4e87421a2 100644 --- a/src/ml/README.md +++ b/src/ml/README.md @@ -1,279 +1,121 @@ -<!-- -title: "Configure machine learning (ML) powered anomaly detection" -custom_edit_url: "https://github.com/netdata/netdata/edit/master/src/ml/README.md" -description: "This is an in-depth look at how Netdata uses ML to detect anomalies." -sidebar_label: "Configure machine learning (ML) powered anomaly detection" -learn_status: "Published" -learn_topic_type: "Tasks" -learn_rel_path: "Configuration" ---> +# ML models and anomaly detection -# Machine learning (ML) powered anomaly detection +In observability, machine learning can be used to detect patterns and anomalies in large datasets, enabling users to identify potential issues before they become critical. -## Overview +At Netdata through understanding what useful insights ML can provide, we created a tool that can improve troubleshooting, reduce mean time to resolution and in many cases prevent issues from escalating. -Machine learning is a subfield of artificial intelligence that enables computers to learn and improve from experience without being explicitly programmed. In monitoring, machine learning can be used to detect patterns and anomalies in large datasets, enabling users to identify potential issues before they become critical. The importance of machine learning in monitoring lies in its ability to analyze vast amounts of data in real-time and provide actionable insights that can help optimize system performance and prevent downtime. Machine learning can also improve the efficiency and scalability of monitoring systems, enabling organizations to monitor complex infrastructures and applications with ease. +> **Note** +> +> If you want to learn how to configure ML on your nodes, check the [ML configuration documentation](https://github.com/netdata/netdata/blob/master/src/ml/ml-configuration.md). -The primary goal of implementing machine learning features in Netdata is to enable users to detect and alert on anomalies in their systems with advanced anomaly detection capabilities. Netdata's machine learning features are designed to be highly customizable and scalable, so users can tailor the ML models and training process to their specific requirements and monitor systems of any size or complexity. +## Design principles -As of [`v1.32.0`](https://github.com/netdata/netdata/releases/tag/v1.32.0), Netdata comes with ML powered [anomaly detection](https://en.wikipedia.org/wiki/Anomaly_detection) capabilities built into it and available to use out of the box, with zero configuration required (ML was enabled by default in `v1.35.0-29-nightly` in [this PR](https://github.com/netdata/netdata/pull/13158), previously it required a one line config change). +The following are the high level design principles of Machine Learning in Netdata: -🚧 **Note**: If you would like to get involved and help us with some feedback, email us at analytics-ml-team@netdata.cloud, comment on the [beta launch post](https://community.netdata.cloud/t/anomaly-advisor-beta-launch/2717) in the Netdata community, or come join us in the [🤖-ml-powered-monitoring](https://discord.gg/4eRSEUpJnc) channel of the Netdata discord. +1. **Unsupervised** -Once ML is enabled, Netdata will begin training a model for each dimension. By default this model is a [k-means clustering](https://en.wikipedia.org/wiki/K-means_clustering) model trained on the most recent 4 hours of data. Rather than just using the most recent value of each raw metric, the model works on a preprocessed ["feature vector"](#feature-vector) of recent smoothed and differenced values. This enables the model to detect a wider range of potentially anomalous patterns in recent observations as opposed to just point anomalies like big spikes or drops. ([This infographic](https://user-images.githubusercontent.com/2178292/144414415-275a3477-5b47-43d6-8959-509eb48ebb20.png) shows some different types of anomalies). + Whatever the ML models can do, they should do it by themselves, without any help or assistance from users. -The sections below will introduce some of the main concepts: -- anomaly bit -- anomaly score -- anomaly rate -- anomaly detector +2. **Real-time** -Additional explanations and details can be found in the [Glossary](#glossary) and [Notes](#notes) at the bottom of the page. + We understand that Machine Learning will have some impact on resource utilization, especially in CPU utilization, but it shouldn't prevent Netdata from being real-time and high-fidelity. -### Anomaly Bit - (100 = Anomalous, 0 = Normal) +3. **Integrated** -Once each model is trained, Netdata will begin producing an ["anomaly score"](#anomaly-score) at each time step for each dimension. This ["anomaly score"](#anomaly-score) is essentially a distance measure to the trained cluster centers of the model (by default each model has k=2, so two cluster centers are learned). More anomalous looking data should be more distant to those cluster centers. If this ["anomaly score"](#anomaly-score) is sufficiently large, this is a sign that the recent raw values of the dimension could potentially be anomalous. By default, "sufficiently large" means that the distance is in the 99th percentile or above of all distances observed during training or, put another way, it has to be further away than the furthest 1% of the data used during training. Once this threshold is passed, the ["anomaly bit"](#anomaly-bit) corresponding to that dimension is set to 100 to flag it as anomalous, otherwise it would be left at 0 to signal normal data. + Everything achieved with Machine Learning should be tightly integrated to the infrastructure exploration and troubleshooting practices we are used to. -What this means is that in addition to the raw value of each metric, Netdata now also stores an ["anomaly bit"](#anomaly-bit) that is either 100 (anomalous) or 0 (normal). Importantly, this is achieved without additional storage overhead due to how the anomaly bit has been implemented within the existing internal Netdata storage representation. +4. **Assist, Advice, Consult** -This ["anomaly bit"](#anomaly-bit) is exposed via the `anomaly-bit` key that can be passed to the `options` param of the `/api/v1/data` REST API. + If we can't be sure that a decision made by Machine Learning is 100% accurate, we should use this to assist and consult users in their journey. -For example, here are some recent raw dimension values for `system.ip` on our [london](http://london.my-netdata.io/) demo server: + In other words, we don't want to wake up someone at 3 AM, just because a model detected something. -[`https://london.my-netdata.io/api/v1/data?chart=system.ip`](https://london.my-netdata.io/api/v1/data?chart=system.ip) +Some of the types of anomalies Netdata detects are: -``` -{ - "labels": ["time", "received", "sent"], - "data": - [ - [ 1638365672, 54.84098, -76.70201], - [ 1638365671, 124.4328, -309.7543], - [ 1638365670, 123.73152, -167.9056], - ... - ] -} -``` +1. **Point Anomalies** or **Strange Points**: Single points that represent very big or very small values, not seen before (in some statistical sense). +2. **Contextual Anomalies** or **Strange Patterns**: Not strange points in their own, but unexpected sequences of points, given the history of the time-series. +3. **Collective Anomalies** or **Strange Multivariate Patterns**: Neither strange points nor strange patterns, but in global sense something looks off. +4. **Concept Drifts** or **Strange Trends**: A slow and steady drift to a new state. +5. **Change Point Detection** or **Strange Step**: A shift occurred and gradually a new normal is established. -And if we add the `&options=anomaly-bit` params, we can see the "anomaly bit" value corresponding to each raw dimension value: +### Models -[`https://london.my-netdata.io/api/v1/data?chart=system.ip&options=anomaly-bit`](https://london.my-netdata.io/api/v1/data?chart=system.ip&options=anomaly-bit) +Once ML is enabled, Netdata will begin training a model for each dimension. By default this model is a [k-means clustering](https://en.wikipedia.org/wiki/K-means_clustering) model trained on the most recent 4 hours of data. -``` -{ - "labels": ["time", "received", "sent"], - "data": - [ - [ 1638365672, 0, 0], - [ 1638365671, 0, 0], - [ 1638365670, 0, 0], - ... - ] -} -``` -In this example, the dimensions "received" and "sent" didn't show any abnormal behavior, so the anomaly bit is zero. -Under normal circumstances, the anomaly bit will mostly be 0. However, there can be random fluctuations setting the anomaly to 100, although this very much depends on the nature of the dimension in question. +Rather than just using the most recent value of each raw metric, the model works on a preprocessed [feature vector](https://en.wikipedia.org/wiki/Feature_(machine_learning)#:~:text=edges%20and%20objects.-,Feature%20vectors,-%5Bedit%5D) of recent smoothed values. -### Anomaly Rate - average(anomaly bit) +This enables the model to detect a wider range of potentially anomalous patterns in recent observations as opposed to just point-anomalies like big spikes or drops. -Once all models have been trained, we can think of the Netdata dashboard as essentially a big matrix or table of 0's and 100's. If we consider this "anomaly bit"-based representation of the state of the node, we can now think about how we might detect overall node level anomalies. The figure below illustrates the main ideas. +Unsupervised models have some noise, random false positives. To remove this noise, Netdata trains multiple machine learning models for each time-series, covering more than the last 2 days in total. -``` - dimensions -time d1 d2 d3 d4 d5 NAR - 1 0 0 0 0 0 0% - 2 0 0 0 0 100 20% - 3 0 0 0 0 0 0% - 4 0 100 0 0 0 20% - 5 100 0 0 0 0 20% - 6 0 100 100 0 100 60% - 7 0 100 0 100 0 40% - 8 0 0 0 0 100 20% - 9 0 0 100 100 0 40% - 10 0 0 0 0 0 0% - -DAR 10% 30% 20% 20% 30% 22% NAR_t1-t10 +Netdata uses all of its available ML models to detect anomalies. So, all machine learning models of a time-series need to agree that a collected sample is an outlier, for it to be marked as an anomaly. -DAR = Dimension Anomaly Rate -NAR = Node Anomaly Rate -NAR_t1-t10 = Node Anomaly Rate over t1 to t10 -``` +This process removes 99% of the false positives, offering reliable unsupervised anomaly detection. -To work out an ["anomaly rate"](#anomaly-rate), we can just average a row or a column in any direction. For example, if we were to just average along a row then this would be the ["node anomaly rate"](#node-anomaly-rate) (all dimensions) at time t. Likewise if we averaged a column then we would have the ["dimension anomaly rate"](#dimension-anomaly-rate) for each dimension over the time window t=1-10. Extending this idea, we can work out an overall ["anomaly rate"](#anomaly-rate) for the whole matrix or any subset of it we might be interested in. +The sections below will introduce you to the main concepts. -### Anomaly Detector - Node level anomaly events +### Anomaly Bit -An ["anomaly detector"](#anomaly-detector) looks at all anomaly bits of a node. Netdata's anomaly detector produces an ["anomaly event"](#anomaly-event) when a the percentage of anomaly bits is high enough for a persistent amount of time. This anomaly event signals that there was sufficient evidence among all the anomaly bits that some strange behavior might have been detected in a more global sense across the node. +Once each model is trained, Netdata will begin producing an **anomaly score** at each time step for each dimension. It **represents a distance measure** to the centers of the model's trained clusters (by default each model has k=2, so two clusters exist for every model). -Essentially if the ["Node Anomaly Rate"](#node-anomaly-rate) (NAR) passes a defined threshold and stays above that threshold for a persistent amount of time, a "Node [Anomaly Event](#anomaly-event)" will be triggered. +Anomalous data should have bigger distance from the cluster centers than points of data that are considered normal. If the anomaly score is sufficiently large, it is a sign that the recent raw values of the dimension could potentially be anomalous. -These anomaly events are currently exposed via the `new_anomaly_event` dimension on the `anomaly_detection.anomaly_detection` chart. - -## Configuration - -If you are running a netdata version after `v1.35.0-29-nightly` then ML will be enabled by default. - -To enable or disable anomaly detection: -1. Find and open the Netdata configuration file `netdata.conf`. -2. In the `[ml]` section, set `enabled = yes` to enable or `enabled = no` to disable. -3. Restart netdata (typically `sudo systemctl restart netdata`). - -> 📑 Note -> -> If you would like to learn more about configuring Netdata please see the [Configuration section](https://github.com/netdata/netdata/blob/master/docs/configure/nodes.md) of our documentation. - -Below is a list of all the available configuration params and their default values. - -``` -[ml] - # enabled = yes - # maximum num samples to train = 21600 - # minimum num samples to train = 900 - # train every = 10800 - # number of models per dimension = 18 - # dbengine anomaly rate every = 30 - # num samples to diff = 1 - # num samples to smooth = 3 - # num samples to lag = 5 - # random sampling ratio = 0.2 - # maximum number of k-means iterations = 1000 - # dimension anomaly score threshold = 0.99 - # host anomaly rate threshold = 1.0 - # anomaly detection grouping method = average - # anomaly detection grouping duration = 300 - # hosts to skip from training = !* - # charts to skip from training = netdata.* - # dimension anomaly rate suppression window = 900 - # dimension anomaly rate suppression threshold = 450 - # delete models older than = 604800 -``` - -### Configuration Examples - -If you would like to run ML on a parent instead of at the edge, some configuration options are illustrated below. - -This example assumes 3 child nodes [streaming](https://github.com/netdata/netdata/blob/master/src/streaming/README.md) to 1 parent node and illustrates the main ways you might want to configure running ML for the children on the parent, running ML on the children themselves, or even a mix of approaches. - -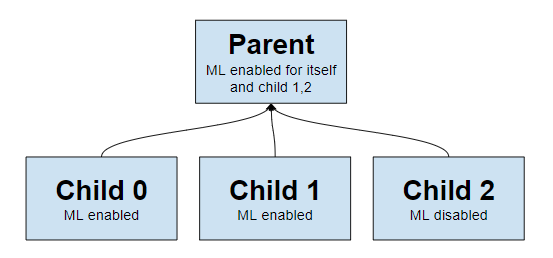 - -``` -# parent will run ML for itself and child 1,2, it will skip running ML for child 0. -# child 0 will run its own ML at the edge. -# child 1 will run its own ML at the edge, even though parent will also run ML for it, a bit wasteful potentially to run ML in both places but is possible (Netdata Cloud will essentially average any overlapping models). -# child 2 will not run ML at the edge, it will be run in the parent only. - -# parent-ml-enabled -# run ML on all hosts apart from child-ml-enabled -[ml] - enabled = yes - hosts to skip from training = child-0-ml-enabled - -# child-0-ml-enabled -# run ML on child-0-ml-enabled -[ml] - enabled = yes - -# child-1-ml-enabled -# run ML on child-1-ml-enabled -[ml] - enabled = yes - -# child-2-ml-disabled -# do not run ML on child-2-ml-disabled -[ml] - enabled = no -``` - -### Descriptions (min/max) - -- `enabled`: `yes` to enable, `no` to disable. -- `maximum num samples to train`: (`3600`/`86400`) This is the maximum amount of time you would like to train each model on. For example, the default of `21600` trains on the preceding 6 hours of data, assuming an `update every` of 1 second. -- `minimum num samples to train`: (`900`/`21600`) This is the minimum amount of data required to be able to train a model. For example, the default of `900` implies that once at least 15 minutes of data is available for training, a model is trained, otherwise it is skipped and checked again at the next training run. -- `train every`: (`1800`/`21600`) This is how often each model will be retrained. For example, the default of `10800` means that each model is retrained every 3 hours. Note: The training of all models is spread out across the `train every` period for efficiency, so in reality, it means that each model will be trained in a staggered manner within each `train every` period. -- `number of models per dimension`: (`1`/`168`) This is the number of trained models that will be used for scoring. For example the default `number of models per dimension = 18` means that the most recently trained 18 models for the dimension will be used to determine the corresponding anomaly bit. This means that under default settings of `maximum num samples to train = 21600`, `train every = 10800` and `number of models per dimension = 18`, netdata will store and use the last 18 trained models for each dimension when determining the anomaly bit. This means that for the latest feature vector in this configuration to be considered anomalous it would need to look anomalous across _all_ the models trained for that dimension in the last 18*(10800/3600) ~= 54 hours. As such, increasing `number of models per dimension` may reduce some false positives since it will result in more models (covering a wider time frame of training) being used during scoring. -- `dbengine anomaly rate every`: (`30`/`900`) This is how often netdata will aggregate all the anomaly bits into a single chart (`anomaly_detection.anomaly_rates`). The aggregation into a single chart allows enabling anomaly rate ranking over _all_ metrics with one API call as opposed to a call per chart. -- `num samples to diff`: (`0`/`1`) This is a `0` or `1` to determine if you want the model to operate on differences of the raw data or just the raw data. For example, the default of `1` means that we take differences of the raw values. Using differences is more general and works on dimensions that might naturally tend to have some trends or cycles in them that is normal behavior to which we don't want to be too sensitive. -- `num samples to smooth`: (`0`/`5`) This is a small integer that controls the amount of smoothing applied as part of the feature processing used by the model. For example, the default of `3` means that the rolling average of the last 3 values is used. Smoothing like this helps the model be a little more robust to spiky types of dimensions that naturally "jump" up or down as part of their normal behavior. -- `num samples to lag`: (`0`/`5`) This is a small integer that determines how many lagged values of the dimension to include in the feature vector. For example, the default of `5` means that in addition to the most recent (by default, differenced and smoothed) value of the dimension, the feature vector will also include the 5 previous values too. Using lagged values in our feature representation allows the model to work over strange patterns over recent values of a dimension as opposed to just focusing on if the most recent value itself is big or small enough to be anomalous. -- `random sampling ratio`: (`0.2`/`1.0`) This parameter determines how much of the available training data is randomly sampled when training a model. The default of `0.2` means that Netdata will train on a random 20% of training data. This parameter influences cost efficiency. At `0.2` the model is still reasonably trained while minimizing system overhead costs caused by the training. -- `maximum number of k-means iterations`: This is a parameter that can be passed to the model to limit the number of iterations in training the k-means model. Vast majority of cases can ignore and leave as default. -- `dimension anomaly score threshold`: (`0.01`/`5.00`) This is the threshold at which an individual dimension at a specific timestep is considered anomalous or not. For example, the default of `0.99` means that a dimension with an anomaly score of 99% or higher is flagged as anomalous. This is a normalized probability based on the training data, so the default of 99% means that anything that is as strange (based on distance measure) or more strange as the most strange 1% of data observed during training will be flagged as anomalous. If you wanted to make the anomaly detection on individual dimensions more sensitive you could try a value like `0.90` (90%) or to make it less sensitive you could try `1.5` (150%). -- `host anomaly rate threshold`: (`0.1`/`10.0`) This is the percentage of dimensions (based on all those enabled for anomaly detection) that need to be considered anomalous at specific timestep for the host itself to be considered anomalous. For example, the default value of `1.0` means that if more than 1% of dimensions are anomalous at the same time then the host itself is considered in an anomalous state. -- `anomaly detection grouping method`: The grouping method used when calculating node level anomaly rate. -- `anomaly detection grouping duration`: (`60`/`900`) The duration across which to calculate the node level anomaly rate, the default of `900` means that the node level anomaly rate is calculated across a rolling 5 minute window. -- `hosts to skip from training`: This parameter allows you to turn off anomaly detection for any child hosts on a parent host by defining those you would like to skip from training here. For example, a value like `dev-*` skips all hosts on a parent that begin with the "dev-" prefix. The default value of `!*` means "don't skip any". -- `charts to skip from training`: This parameter allows you to exclude certain charts from anomaly detection. By default, only netdata related charts are excluded. This is to avoid the scenario where accessing the netdata dashboard could itself trigger some anomalies if you don't access them regularly. If you want to include charts that are excluded by default, add them in small groups and then measure any impact on performance before adding additional ones. Example: If you want to include system, apps, and user charts:`!system.* !apps.* !user.* *`. -- `delete models older than`: (`86400`/`604800`) Delete old models from the database that are unused, by default models will be deleted after 7 days. - -## Charts - -Once enabled, the "Anomaly Detection" menu and charts will be available on the dashboard. - -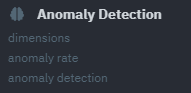 - -In terms of anomaly detection, the most interesting charts would be the `anomaly_detection.dimensions` and `anomaly_detection.anomaly_rate` ones, which hold the `anomalous` and `anomaly_rate` dimensions that show the overall number of dimensions considered anomalous at any time and the corresponding anomaly rate. - -- `anomaly_detection.dimensions`: Total count of dimensions considered anomalous or normal. -- `anomaly_detection.anomaly_rate`: Percentage of anomalous dimensions. -- `anomaly_detection.anomaly_detection`: Flags (0 or 1) to show when an anomaly event has been triggered by the detector. +By default, the threshold is that the anomalous data's distance from the center of the cluster should be greater than the 99th percentile distance of the data used in training. -Below is an example of how these charts may look in the presence of an anomaly event. +Once this threshold is passed, the anomaly bit corresponding to that dimension is set to `true` to flag it as anomalous, otherwise it would be left as `false` to signal normal data. -Initially we see a jump in `anomalous` dimensions: +#### How the anomaly bit is used -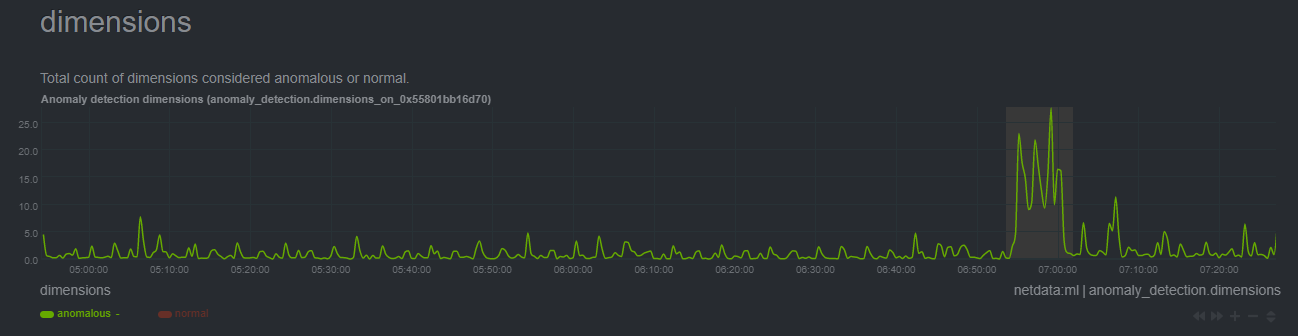 +In addition to the raw value of each metric, Netdata also stores the anomaly bit **that is either 100 (anomalous) or 0 (normal)**. -And a corresponding jump in the `anomaly_rate`: +More importantly, this is achieved without additional storage overhead as this bit is embedded into the custom floating point number the Netdata database uses, so it does not introduce any overheads in memory or disk footprint. -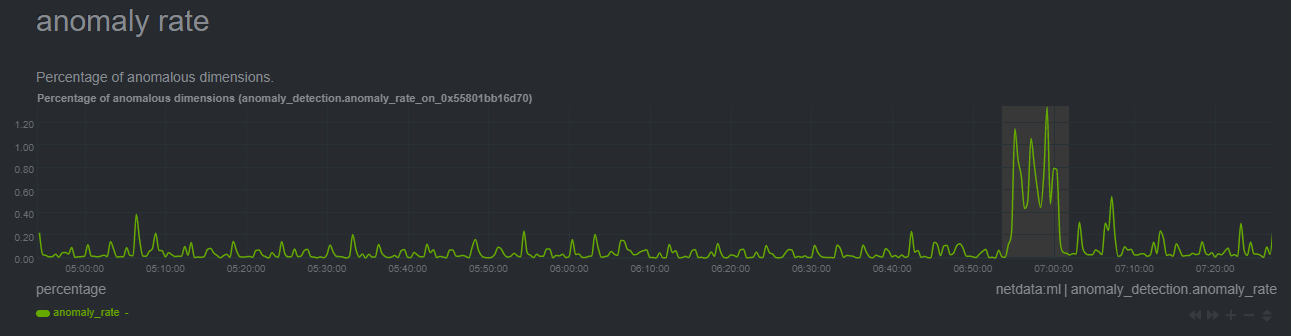 +The query engine of Netdata uses this bit to compute anomaly rates while it executes normal time-series queries. This eliminates to need for additional queries for anomaly rates, as all `/api/v2` time-series query include anomaly rate information. -After a short while the rolling node anomaly rate goes `above_threshold`, and once it stays above threshold for long enough a `new_anomaly_event` is created: +### Anomaly Rate -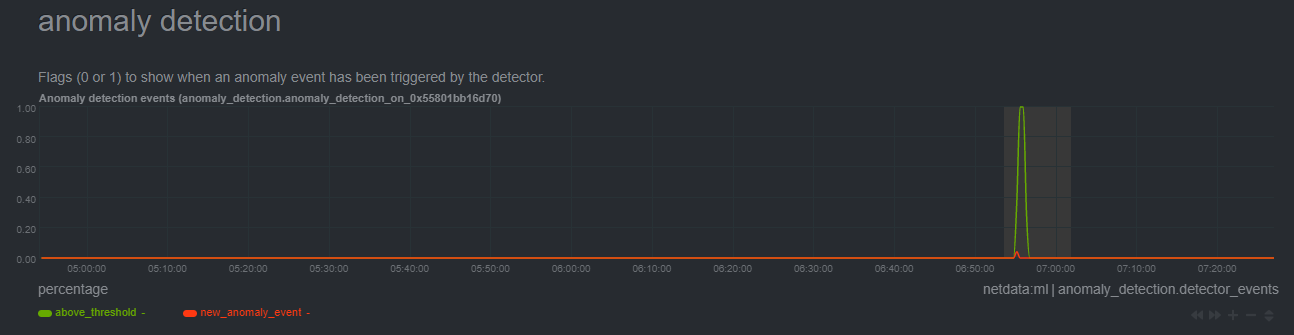 +Once all models have been trained, we can think of the Netdata dashboard as a big matrix/table of 0 and 100 values. If we consider this anomaly bit based representation of the state of the node, we can now detect overall node level anomalies. -## Glossary +This figure illustrates the main idea (the x axis represents dimensions and the y axis time): -#### _feature vector_ +| | d1 | d2 | d3 | d4 | d5 | **NAR** | +|---------|---------|---------|---------|---------|---------|-----------------------| +| t1 | 0 | 0 | 0 | 0 | 0 | **0%** | +| t2 | 0 | 0 | 0 | 0 | 100 | **20%** | +| t3 | 0 | 0 | 0 | 0 | 0 | **0%** | +| t4 | 0 | 100 | 0 | 0 | 0 | **20%** | +| t5 | 100 | 0 | 0 | 0 | 0 | **20%** | +| t6 | 0 | 100 | 100 | 0 | 100 | **60%** | +| t7 | 0 | 100 | 0 | 100 | 0 | **40%** | +| t8 | 0 | 0 | 0 | 0 | 100 | **20%** | +| t9 | 0 | 0 | 100 | 100 | 0 | **40%** | +| t10 | 0 | 0 | 0 | 0 | 0 | **0%** | +| **DAR** | **10%** | **30%** | **20%** | **20%** | **30%** | **_NAR_t1-10 = 22%_** | -A [feature vector](https://en.wikipedia.org/wiki/Feature_(machine_learning)) is what the ML model is trained on and uses for prediction. The most simple feature vector would be just the latest raw dimension value itself [x]. By default Netdata will use a feature vector consisting of the 6 latest differences and smoothed values of the dimension so conceptually something like `[avg3(diff1(x-5)), avg3(diff1(x-4)), avg3(diff1(x-3)), avg3(diff1(x-2)), avg3(diff1(x-1)), avg3(diff1(x))]` which ends up being just 6 floating point numbers that try and represent the "shape" of recent data. +- DAR = Dimension Anomaly Rate +- NAR = Node Anomaly Rate +- NAR_t1-t10 = Node Anomaly Rate over t1 to t10 -#### _anomaly score_ +To calculate an anomaly rate, we can take the average of a row or a column in any direction. -At prediction time the anomaly score is just the distance of the most recent feature vector to the trained cluster centers of the model, which are themselves just feature vectors, albeit supposedly the best most representative feature vectors that could be "learned" from the training data. So if the most recent feature vector is very far away in terms of [euclidean distance](https://en.wikipedia.org/wiki/Euclidean_distance#:~:text=In%20mathematics%2C%20the%20Euclidean%20distance,being%20called%20the%20Pythagorean%20distance.) it's more likely that the recent data it represents consists of some strange pattern not commonly found in the training data. +For example, if we were to average along one row then this would be the Node Anomaly Rate, NAR (for all dimensions) at time `t`. -#### _anomaly bit_ +Likewise if we averaged a column then we would have the dimension anomaly rate for each dimension over the time window `t = 1-10`. Extending this idea, we can work out an overall anomaly rate for the whole matrix or any subset of it we might be interested in. -If the anomaly score is greater than a specified threshold then the most recent feature vector, and hence most recent raw data, is considered anomalous. Since storing the raw anomaly score would essentially double amount of storage space Netdata would need, we instead efficiently store just the anomaly bit in the existing internal Netdata data representation without any additional storage overhead. +### Anomaly detector, node level anomaly events -#### _anomaly rate_ +An anomaly detector looks at all the anomaly bits of a node. Netdata's anomaly detector produces an anomaly event when the percentage of anomaly bits is high enough for a persistent amount of time. -An anomaly rate is really just an average over one or more anomaly bits. An anomaly rate can be calculated over time for one or more dimensions or at a point in time across multiple dimensions, or some combination of the two. Its just an average of some collection of anomaly bits. +This anomaly event signals that there was sufficient evidence among all the anomaly bits that some strange behavior might have been detected in a more global sense across the node. -#### _anomaly detector_ +Essentially if the Node Anomaly Rate (NAR) passes a defined threshold and stays above that threshold for a persistent amount of time, a node anomaly event will be triggered. -The is essentially business logic that just tries to process a collection of anomaly bits to determine if there is enough active anomaly bits to merit investigation or declaration of a node level anomaly event. - -#### _anomaly event_ - -Anomaly events are triggered by the anomaly detector and represent a window of time on the node with sufficiently elevated anomaly rates across all dimensions. - -#### _dimension anomaly rate_ - -The anomaly rate of a specific dimension over some window of time. - -#### _node anomaly rate_ +These anomaly events are currently exposed via the `new_anomaly_event` dimension on the `anomaly_detection.anomaly_detection` chart. -The anomaly rate across all dimensions of a node. +## Charts -## Notes +Once enabled, the "Anomaly Detection" menu and charts will be available on the dashboard. -- We would love to hear any feedback relating to this functionality, please email us at analytics-ml-team@netdata.cloud or come join us in the [🤖-ml-powered-monitoring](https://discord.gg/4eRSEUpJnc) channel of the Netdata discord. -- We are working on additional UI/UX based features that build on these core components to make them as useful as possible out of the box. -- Although not yet a core focus of this work, users could leverage the `anomaly_detection` chart dimensions and/or `anomaly-bit` options in defining alerts based on ML driven anomaly detection models. -- [This presentation](https://docs.google.com/presentation/d/18zkCvU3nKP-Bw_nQZuXTEa4PIVM6wppH3VUnAauq-RU/edit?usp=sharing) walks through some of the main concepts covered above in a more informal way. -- After restart Netdata will wait until `minimum num samples to train` observations of data are available before starting training and prediction. -- Netdata uses [dlib](https://github.com/davisking/dlib) under the hood for its core ML features. -- You should benchmark Netdata resource usage before and after enabling ML. Typical overhead ranges from 1-2% additional CPU at most. -- The "anomaly bit" has been implemented to be a building block to underpin many more ML based use cases that we plan to deliver soon. -- At its core Netdata uses an approach and problem formulation very similar to the Netdata python [anomalies collector](https://github.com/netdata/netdata/blob/master/src/collectors/python.d.plugin/anomalies/README.md), just implemented in a much much more efficient and scalable way in the agent in c++. So if you would like to learn more about the approach and are familiar with Python that is a useful resource to explore, as is the corresponding [deep dive tutorial](https://nbviewer.org/github/netdata/community/blob/main/netdata-agent-api/netdata-pandas/anomalies_collector_deepdive.ipynb) where the default model used is PCA instead of K-Means but the overall approach and formulation is similar. -- Check out our ML related blog posts over at [https://blog.netdata.cloud](https://blog.netdata.cloud/tags/machine-learning) +- `anomaly_detection.dimensions`: Total count of dimensions considered anomalous or normal. +- `anomaly_detection.anomaly_rate`: Percentage of anomalous dimensions. +- `anomaly_detection.anomaly_detection`: Flags (0 or 1) to show when an anomaly event has been triggered by the detector. |