
diff options
| author | Fotis Voutsas <fotis@netdata.cloud> | 2024-04-22 15:01:18 +0300 |
|---|---|---|
| committer | GitHub <noreply@github.com> | 2024-04-22 15:01:18 +0300 |
| commit | 3a019641e02fe08acbb9a3d0cb1186844f77bb34 (patch) | |
| tree | 6b351d4f31b0e3ec71be3988dd7b8a1e4949c6dd | |
| parent | 238214a917133499b67b13ffda680ae77965d918 (diff) | |
move dashboards file (#17479)
fix link
| -rw-r--r-- | docs/guides/troubleshoot/monitor-debug-applications-ebpf.md | 2 | ||||
| -rw-r--r-- | docs/quickstart/infrastructure.md | 10 | ||||
| -rw-r--r-- | src/web/gui/custom/README.md | 2 |
3 files changed, 7 insertions, 7 deletions
diff --git a/docs/guides/troubleshoot/monitor-debug-applications-ebpf.md b/docs/guides/troubleshoot/monitor-debug-applications-ebpf.md index 5e60f6f8d9..e99cfc9ed5 100644 --- a/docs/guides/troubleshoot/monitor-debug-applications-ebpf.md +++ b/docs/guides/troubleshoot/monitor-debug-applications-ebpf.md @@ -243,7 +243,7 @@ You can also read how to [monitor your infrastructure with Netdata Cloud](https: Once you've added one or more nodes to a Space in Netdata Cloud, you can see aggregated eBPF metrics in the Overview dashboard under the same **Applications** or **eBPF** sections that you -find on the local Agent dashboard. Or, [create new dashboards](https://github.com/netdata/netdata/blob/master/docs/cloud/dashboard/dashboards-tab.md) using eBPF metrics +find on the local Agent dashboard. Or, [create new dashboards](https://github.com/netdata/netdata/blob/master/docs/dashboard/dashboards-tab.md) using eBPF metrics from any number of distributed nodes to see how your application interacts with multiple Linux kernels on multiple Linux systems. diff --git a/docs/quickstart/infrastructure.md b/docs/quickstart/infrastructure.md index 53a04b9b81..06ce860ac3 100644 --- a/docs/quickstart/infrastructure.md +++ b/docs/quickstart/infrastructure.md @@ -77,7 +77,7 @@ These tabs can be separated into "static", meaning they are by default presented - [Kubernetes tab](https://github.com/netdata/netdata/blob/master/docs/cloud/visualize/kubernetes.md) is a logical grouping of charts regarding your Kubernetes clusters. It contains a subset of the charts available in the **Overview tab**. -- The [Dashboards tab](https://github.com/netdata/netdata/blob/master/docs/cloud/dashboard/dashboards-tab.md) gives you the ability to have tailored made views of specific/targeted interfaces for your infrastructure using any number of charts from any number of nodes. +- The [Dashboards tab](https://github.com/netdata/netdata/blob/master/docs/dashboard/dashboards-tab.md) gives you the ability to have tailored made views of specific/targeted interfaces for your infrastructure using any number of charts from any number of nodes. - The [Alerts tab](https://github.com/netdata/netdata/blob/master/docs/monitor/view-active-alerts.md) provides you with an overview for all the active alerts you receive for the nodes in this War Room, you can also see all the alerts that are configured to be triggered in any given moment. @@ -89,7 +89,7 @@ These tabs can be separated into "static", meaning they are by default presented #### Dynamic tabs -If you open a [new dashboard](https://github.com/netdata/netdata/blob/master/docs/cloud/dashboard/dashboards-tab.md), jump to a single-node dashboard, or navigate to a dedicated alert page, a new tab will open in War Room bar. +If you open a [new dashboard](https://github.com/netdata/netdata/blob/master/docs/dashboard/dashboards-tab.md), jump to a single-node dashboard, or navigate to a dedicated alert page, a new tab will open in War Room bar. Tabs can be rearranged with drag-and-drop or closed with the **X** button. Open tabs persist between sessions, so you can always come right back to your preferred setup. @@ -112,7 +112,7 @@ from every node in your infrastructure on a single dashboard. 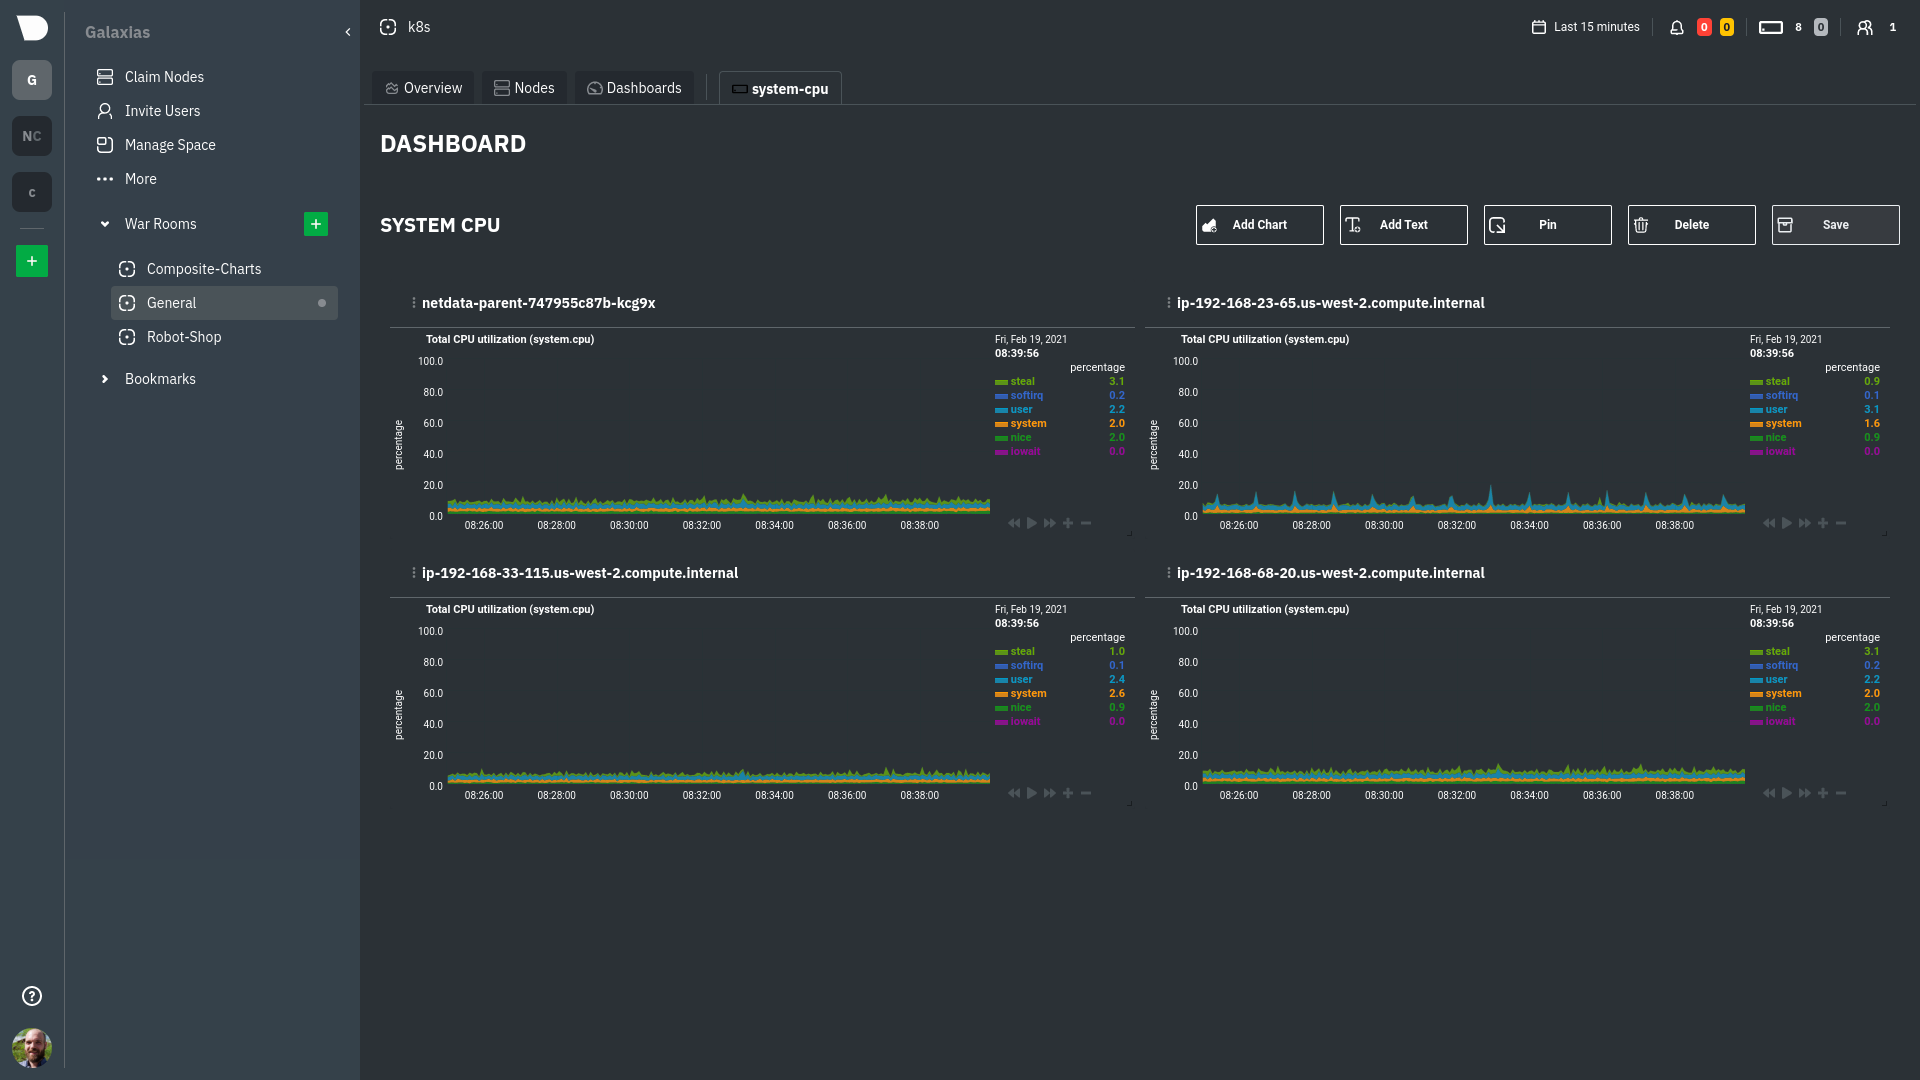 -Read more about [creating new dashboards](https://github.com/netdata/netdata/blob/master/docs/cloud/dashboard/dashboards-tab.md) for more details about the process and +Read more about [creating new dashboards](https://github.com/netdata/netdata/blob/master/docs/dashboard/dashboards-tab.md) for more details about the process and additional tips on best leveraging the feature to help you troubleshoot complex performance problems. ## Set up your nodes @@ -174,7 +174,7 @@ collect from across your infrastructure with Netdata. <BoxListItemRegexLink to="[](https://github.com/netdata/netdata/blob/master/docs/dashboard/metrics-tab-and-single-node-tabs.md)" title="Metrics tab" /> <BoxListItemRegexLink to="[](https://github.com/netdata/netdata/blob/master/docs/dashboard/nodes-tab.md)" title="Nodes tab" /> <BoxListItemRegexLink to="[](https://github.com/netdata/netdata/blob/master/docs/cloud/visualize/kubernetes.md)" title="Kubernetes" /> - <BoxListItemRegexLink to="[](https://github.com/netdata/netdata/blob/master/docs/cloud/dashboard/dashboards-tab.md)" title="Create new dashboards" /> + <BoxListItemRegexLink to="[](https://github.com/netdata/netdata/blob/master/docs/dashboard/dashboards-tab.md)" title="Create new dashboards" /> </BoxList> </Box> <Box @@ -209,7 +209,7 @@ collect from across your infrastructure with Netdata. - [Metrics tab](https://github.com/netdata/netdata/blob/master/docs/dashboard/metrics-tab-and-single-node-tabs.md) - [Nodes tab](https://github.com/netdata/netdata/blob/master/docs/dashboard/nodes-tab.md) - [Kubernetes](https://github.com/netdata/netdata/blob/master/docs/cloud/visualize/kubernetes.md) - - [Create new dashboards](https://github.com/netdata/netdata/blob/master/docs/cloud/dashboard/dashboards-tab.md) + - [Create new dashboards](https://github.com/netdata/netdata/blob/master/docs/dashboard/dashboards-tab.md) - Alerts and notifications - [View active alerts](https://github.com/netdata/netdata/blob/master/docs/monitor/view-active-alerts.md#netdata-cloud) - [Alert notifications](https://github.com/netdata/netdata/blob/master/docs/cloud/alerts-notifications/notifications.md) diff --git a/src/web/gui/custom/README.md b/src/web/gui/custom/README.md index fbce349662..c9ac76c065 100644 --- a/src/web/gui/custom/README.md +++ b/src/web/gui/custom/README.md @@ -1,7 +1,7 @@ # Build new dashboards with HTML >❗This feature is only available on v1 dashboards and is not currently supported on v2. -> For more information on the new Custom Dashboards check [this documentation](https://github.com/netdata/netdata/blob/master/docs/cloud/dashboard/dashboards-tab.md). +> For more information on the new Custom Dashboards check [this documentation](https://github.com/netdata/netdata/blob/master/docs/dashboard/dashboards-tab.md). You can build dashboards with Netdata charts just with some basic HTML knowledge. |