
diff options
| author | Fotis Voutsas <fotis@netdata.cloud> | 2024-04-05 15:04:44 +0300 |
|---|---|---|
| committer | GitHub <noreply@github.com> | 2024-04-05 15:04:44 +0300 |
| commit | 128f112c7313ce97d166213303f1bc47500369d3 (patch) | |
| tree | 499bcb15842e539fb2dc35d1a7a886f99613ddae | |
| parent | cfae735749c22237f2fbeb6f5a55d33323ae39d7 (diff) | |
remove old overview infrastructure and add home tab doc (#17323)
Co-authored-by: Ilya Mashchenko <ilya@netdata.cloud>
Co-authored-by: Hugo Valente <82235632+hugovalente-pm@users.noreply.github.com>
| -rw-r--r-- | docs/collect/application-metrics.md | 2 | ||||
| -rw-r--r-- | docs/collect/container-metrics.md | 2 | ||||
| -rw-r--r-- | docs/dashboard/home-tab.md | 60 | ||||
| -rw-r--r-- | docs/guides/monitor/kubernetes-k8s-netdata.md | 3 | ||||
| -rw-r--r-- | docs/guides/troubleshoot/monitor-debug-applications-ebpf.md | 4 | ||||
| -rw-r--r-- | docs/quickstart/infrastructure.md | 3 | ||||
| -rw-r--r-- | docs/visualize/overview-infrastructure.md | 95 | ||||
| -rw-r--r-- | packaging/installer/methods/ansible.md | 4 |
8 files changed, 67 insertions, 106 deletions
diff --git a/docs/collect/application-metrics.md b/docs/collect/application-metrics.md index f3c97ee1a0..77d22b1864 100644 --- a/docs/collect/application-metrics.md +++ b/docs/collect/application-metrics.md @@ -78,6 +78,6 @@ collector](https://github.com/netdata/netdata/blob/master/src/go/collectors/go.d Collecting all the available metrics on your nodes, and across your entire infrastructure, is just one piece of the puzzle. Next, learn more about Netdata's famous real-time visualizations by [seeing an overview of your -infrastructure](https://github.com/netdata/netdata/blob/master/docs/visualize/overview-infrastructure.md) using Netdata Cloud. +infrastructure](https://github.com/netdata/netdata/blob/master/docs/dashboard/home-tab.md) using Netdata Cloud. diff --git a/docs/collect/container-metrics.md b/docs/collect/container-metrics.md index aecf7eee28..796eff0181 100644 --- a/docs/collect/container-metrics.md +++ b/docs/collect/container-metrics.md @@ -96,6 +96,6 @@ Netdata is capable of collecting metrics from hundreds of applications, such as brokers, and more. See more in the [application metrics doc](https://github.com/netdata/netdata/blob/master/docs/collect/application-metrics.md). If you already have all the information you need about collecting metrics, move into Netdata's meaningful visualizations -with [seeing an overview of your infrastructure](https://github.com/netdata/netdata/blob/master/docs/visualize/overview-infrastructure.md) using Netdata Cloud. +with [seeing an overview of your infrastructure](https://github.com/netdata/netdata/blob/master/docs/dashboard/home-tab.md) using Netdata Cloud. diff --git a/docs/dashboard/home-tab.md b/docs/dashboard/home-tab.md new file mode 100644 index 0000000000..86433e534c --- /dev/null +++ b/docs/dashboard/home-tab.md @@ -0,0 +1,60 @@ +# Home Tab + +The Home tab allows users to see an overview of their Room. + +## Total nodes + +The total number of nodes is presented and dissected by their state, Live, Offline or Stale. + +## Active alerts + +The number of active alerts is presented in a donut chart, while also having counters for both Critical and Warning alerts. + +## Nodes map + +A map consisting of node entries allows for quick hoverable information about each node, while also presenting node status in a color-coded way. + +The map classification can be altered, allowing the categorization of nodes by: + +- Status (e.g. Live) +- OS (e.g. Ubuntu) +- Technology (e.g. Container) +- Agent version (e.g. v1.45.2) +- Replication factor (e.g. Single, Multi) +- Cloud provider (e.g AWS) +- Cloud region (e.g. us-east-1) +- Instance type (e.g. c6a.xlarge) + +Color-coding can also be configured between: + +- Status (e.g. Live, Offline) +- Connection stability (e.g. Stable, Unstable) +- Replication factor (e.g. None, Single) + +## Data replication + +There are two views about data replication in the Home tab: + +The first bar chart presents the amount of **Parents**, **Children** and **Standalone** nodes. + +The second bar chart presents the number of nodes depending on their Replication factor, **None**, **Single** and **Multi**. + +## Alerts overview over the last 24h + +There are two views that display information about nodes that produced the most alerts and top alerts in the last 24 hours. + +The first bar chart presents the nodes that produced the most alerts in a time window of the last 24 hours. + +The second table contains the top alerts in the last 24 hours, along with their instance, the occurrences and their duration in seconds. + +## Netdata Assistant shortcut + +In the Home tab there is a shortcut button in order to start an instant conversation with the [Netdata Assistant](https://github.com/netdata/netdata/edit/master/docs/cloud/netdata-assistant.md). + +## Space metrics + +There are three key metrics that are displayed in the Home tab, **Metrics collected**, **Charts visualized** and **Alerts configured**. + +## Data retention per Nodes + +This bar chart shows the number of nodes based on their retention period. diff --git a/docs/guides/monitor/kubernetes-k8s-netdata.md b/docs/guides/monitor/kubernetes-k8s-netdata.md index 982c35e793..feefdc7208 100644 --- a/docs/guides/monitor/kubernetes-k8s-netdata.md +++ b/docs/guides/monitor/kubernetes-k8s-netdata.md @@ -118,9 +118,6 @@ cluster](https://user-images.githubusercontent.com/1153921/109042169-19c8fa00-76 For example, the chart above shows a spike in the CPU utilization from `rabbitmq` every minute or so, along with a baseline CPU utilization of 10-15% across the cluster. -Read about the [Overview](https://github.com/netdata/netdata/blob/master/docs/cloud/visualize/overview.md) and some best practices on [viewing -an overview of your infrastructure](https://github.com/netdata/netdata/blob/master/docs/visualize/overview-infrastructure.md) for details on using composite charts to -drill down into per-node performance metrics. ## Pod and container metrics diff --git a/docs/guides/troubleshoot/monitor-debug-applications-ebpf.md b/docs/guides/troubleshoot/monitor-debug-applications-ebpf.md index 728606c831..c75037d8ce 100644 --- a/docs/guides/troubleshoot/monitor-debug-applications-ebpf.md +++ b/docs/guides/troubleshoot/monitor-debug-applications-ebpf.md @@ -241,8 +241,8 @@ findings with someone else on your team. If you don't already have a Netdata Cloud account, go [sign in](https://app.netdata.cloud) and get started for free. You can also read how to [monitor your infrastructure with Netdata Cloud](https://github.com/netdata/netdata/blob/master/docs/quickstart/infrastructure.md) to understand the key features that it has to offer. -Once you've added one or more nodes to a Space in Netdata Cloud, you can see aggregated eBPF metrics in the [Overview -dashboard](https://github.com/netdata/netdata/blob/master/docs/visualize/overview-infrastructure.md) under the same **Applications** or **eBPF** sections that you +Once you've added one or more nodes to a Space in Netdata Cloud, you can see aggregated eBPF metrics in the Overview +dashboard under the same **Applications** or **eBPF** sections that you find on the local Agent dashboard. Or, [create new dashboards](https://github.com/netdata/netdata/blob/master/docs/cloud/visualize/dashboards.md) using eBPF metrics from any number of distributed nodes to see how your application interacts with multiple Linux kernels on multiple Linux systems. diff --git a/docs/quickstart/infrastructure.md b/docs/quickstart/infrastructure.md index 2671228324..4ee593dfe1 100644 --- a/docs/quickstart/infrastructure.md +++ b/docs/quickstart/infrastructure.md @@ -99,8 +99,7 @@ Both the Overview and the Nodes tab offer easy access to **single-node dashboard single-node dashboards in Netdata Cloud to drill down on specific issues, scrub backward in time to investigate historical data, and see like metrics presented meaningfully to help you troubleshoot performance problems. -Read about the process in the [infrastructure -overview](https://github.com/netdata/netdata/blob/master/docs/visualize/overview-infrastructure.md#drill-down-with-single-node-dashboards) doc, then learn about [interacting with +Learn more about [interacting with dashboards and charts](https://github.com/netdata/netdata/blob/master/docs/cloud/visualize/interact-new-charts.md) to get the most from all of Netdata's real-time metrics. diff --git a/docs/visualize/overview-infrastructure.md b/docs/visualize/overview-infrastructure.md deleted file mode 100644 index 3b1f7fcc53..0000000000 --- a/docs/visualize/overview-infrastructure.md +++ /dev/null @@ -1,95 +0,0 @@ -<!-- -title: "See an overview of your infrastructure" -description: "With Netdata Cloud's War Rooms, you can see real-time metrics, from any number of nodes in your infrastructure, in composite charts." -custom_edit_url: https://github.com/netdata/netdata/edit/master/docs/visualize/overview-infrastructure.md -sidebar_label: "See an overview of your infrastructure" -learn_status: "Published" -learn_topic_type: "Tasks" -learn_rel_path: "Operations/Netdata Cloud Visualizations" ---> - -# See an overview of your infrastructure - -In Netdata Cloud, your nodes are organized into War Rooms. One of the two available views for a War Room is the -[**Overview**](https://github.com/netdata/netdata/blob/master/docs/cloud/visualize/overview.md), which uses composite charts to display -real-time, aggregated metrics from all the nodes (or a filtered selection) in a given War Room. - -With Overview's composite charts, you can see your infrastructure from a single pane of glass, discover trends or -anomalies, then drill down with filtering or single-node dashboards to see more. In the screenshot below, -each chart visualizes average or sum metrics values from across 5 distributed nodes. - -Netdata also supports robust Kubernetes monitoring using the Overview. Read our [deployment -doc](https://github.com/netdata/netdata/blob/master/packaging/installer/methods/kubernetes.md) for details on visualizing Kubernetes metrics in Netdata Cloud. - -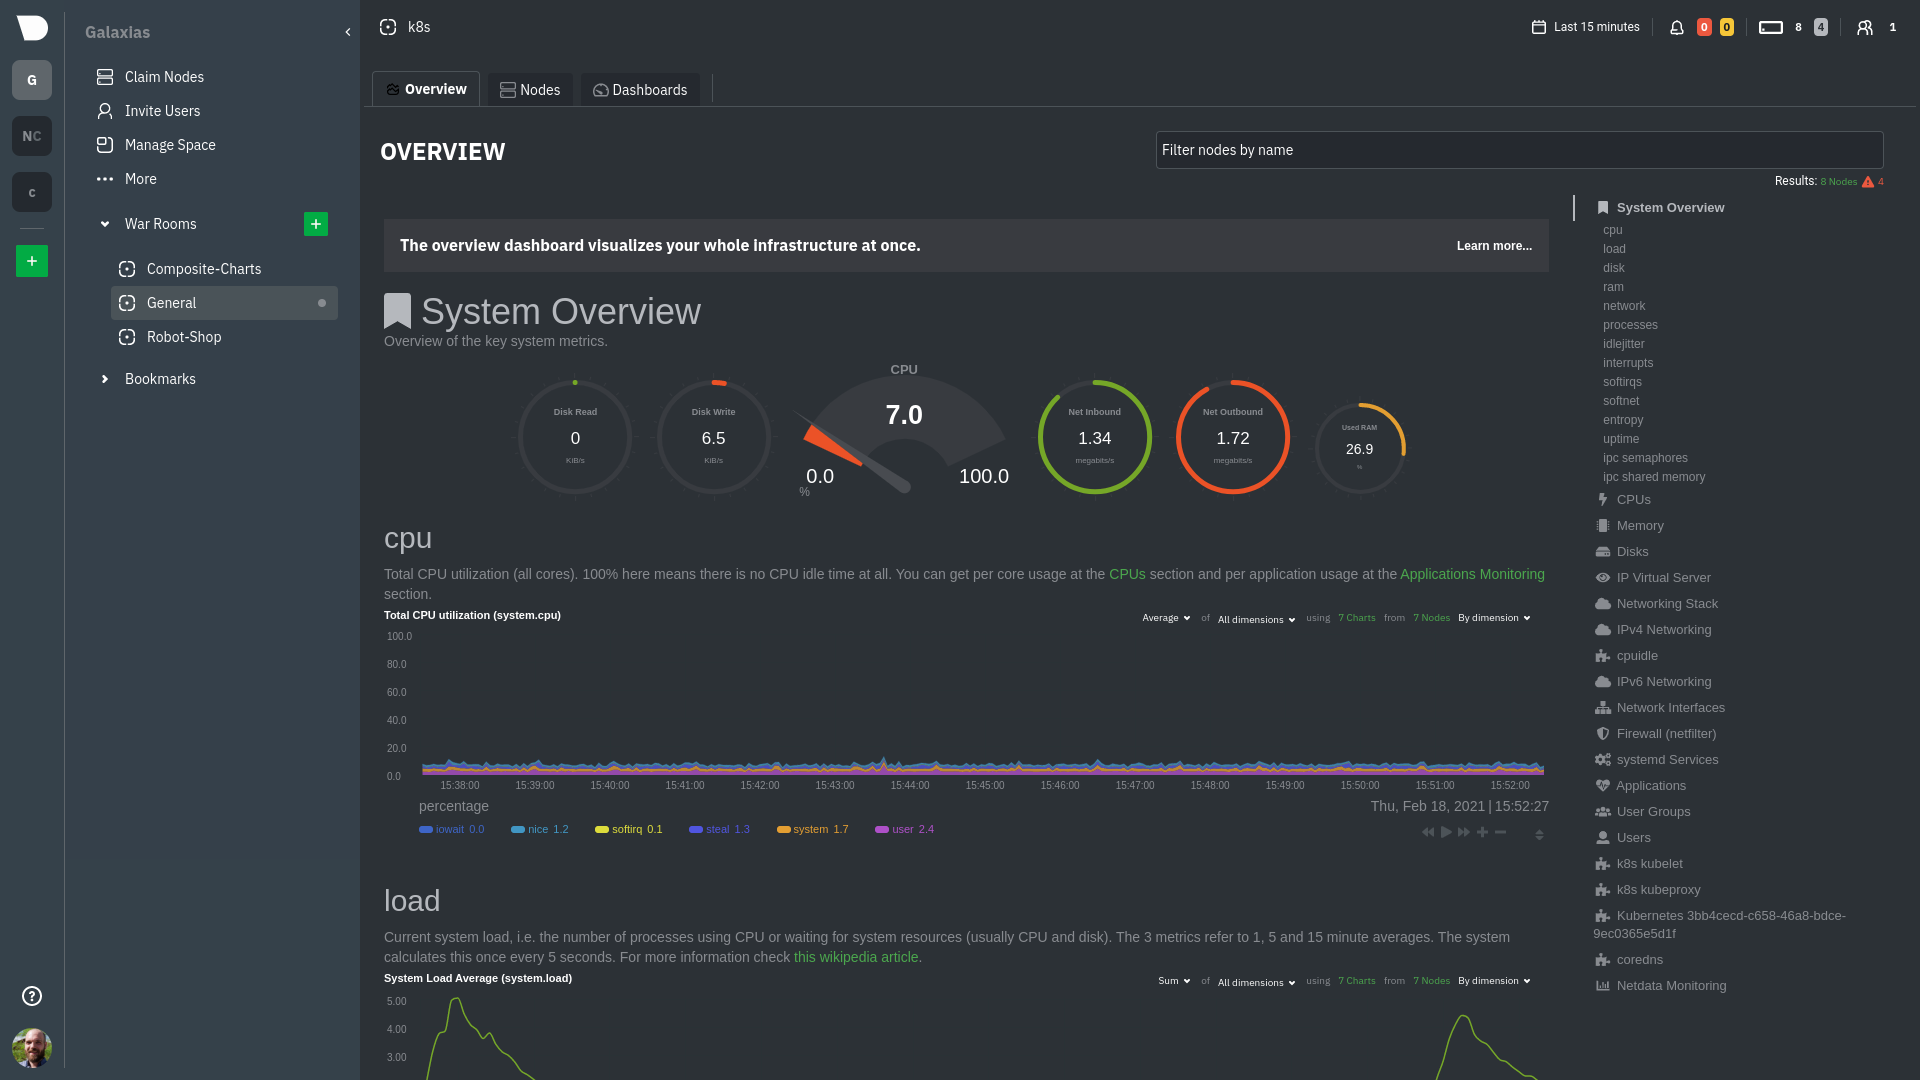 - -## Using the Overview - -The Overview uses roughly the same interface as local Agent dashboards or single-node dashboards in Netdata Cloud. By -showing all available metrics from all your nodes in a single interface, Netdata Cloud helps you visualize the overall -health of your infrastructure. Best of all, you don't have to worry about creating your own dashboards just to get -started with infrastructure monitoring. - -Let's walk through some examples of using the Overview to monitor and troubleshoot your infrastructure. - -### Filter nodes and pick relevant times - -While not exclusive to Overview, you can use two important features, [node -filtering](https://github.com/netdata/netdata/blob/master/docs/cloud/visualize/node-filter.md) and the [time & date -picker](https://github.com/netdata/netdata/blob/master/docs/dashboard/visualization-date-and-time-controls.md), to widen or narrow your infrastructure -monitoring focus. - -By default, the Overview shows composite charts aggregated from every node in the War Room, but you can change that -behavior on an ad-hoc basis. The node filter allows you to create complex queries against your infrastructure based on -the name, OS, or services running on nodes. For example, use `(name contains aws AND os contains ubuntu) OR services == -apache` to show only nodes that have `aws` in the hostname and are Ubuntu-based, or any nodes that have an Apache -webserver running on them. - -The time & date picker helps you visualize both small and large timeframes depending on your goals, whether that's -establishing a baseline of infrastructure performance or targeted root cause analysis of a specific anomaly. - -For example, use the **Quick Selector** options to pick the 12-hour option first thing in the morning to check your -infrastructure for any odd behavior overnight. Use the 7-day option to observe trends between various days of the week. - -See the [War Rooms](https://github.com/netdata/netdata/blob/master/docs/cloud/manage/organize-your-infrastrucutre-invite-your-team.md#netdata-cloud-war-rooms) docs for more details on both features. - -### Configure composite charts to identify problems - -Let's say you notice a sharp decrease in available RAM for applications, as seen in the example screenshot below. In -this situation, you can see when the anomalous behavior began and that it affects the average available and committed -RAM across your infrastructure. However, when _grouped by dimension_, composite charts cannot show whether an anomaly -affects a single node, a subset of nodes, or an entire infrastructure. - - - -Use [_group by node_](https://github.com/netdata/netdata/blob/master/docs/cloud/visualize/overview.md#group-by-dimension-or-node) to visualize -a single metric across all contributing nodes. If the composite chart has 5 contributing nodes, there will be 5 -lines/areas, one for the most relevant dimension from each node. - - - -After grouping by node, it's clear that the `Composite-Charts-01` node is experiencing anomalous behavior and should be -investigated further by jumping to its [single-node dashboard](#drill-down-with-single-node-dashboards) in Netdata -Cloud. - -### Drill down with single-node dashboards - -Click on **X Charts** of any composite chart's definition bar to display a dropdown of contributing contexts and nodes -contributing. Click on the link icon <img class="img__inline img__inline--link" -src="https://user-images.githubusercontent.com/1153921/95762109-1d219300-0c62-11eb-8daa-9ba509a8e71c.png" /> next to a -given node to quickly _jump to the same chart in that node's single-node dashboard_ in Netdata Cloud. - -You can use single-node dashboards in Netdata Cloud to drill down on specific issues, scrub backward in time to -investigate historical data, and see like metrics presented meaningfully to help you troubleshoot performance problems. -All of the familiar [interactions](https://github.com/netdata/netdata/blob/master/docs/cloud/visualize/interact-new-charts.md) are available, as is adding any chart -to a [new dashboard](https://github.com/netdata/netdata/blob/master/docs/cloud/visualize/dashboards.md). - -## Nodes tab - -You can also use the **Nodes tab** to monitor the health status and user-configurable key metrics from multiple nodes -in a War Room. Read the [Nodes tab documentation](https://github.com/netdata/netdata/blob/master/docs/cloud/visualize/nodes.md) for details. - -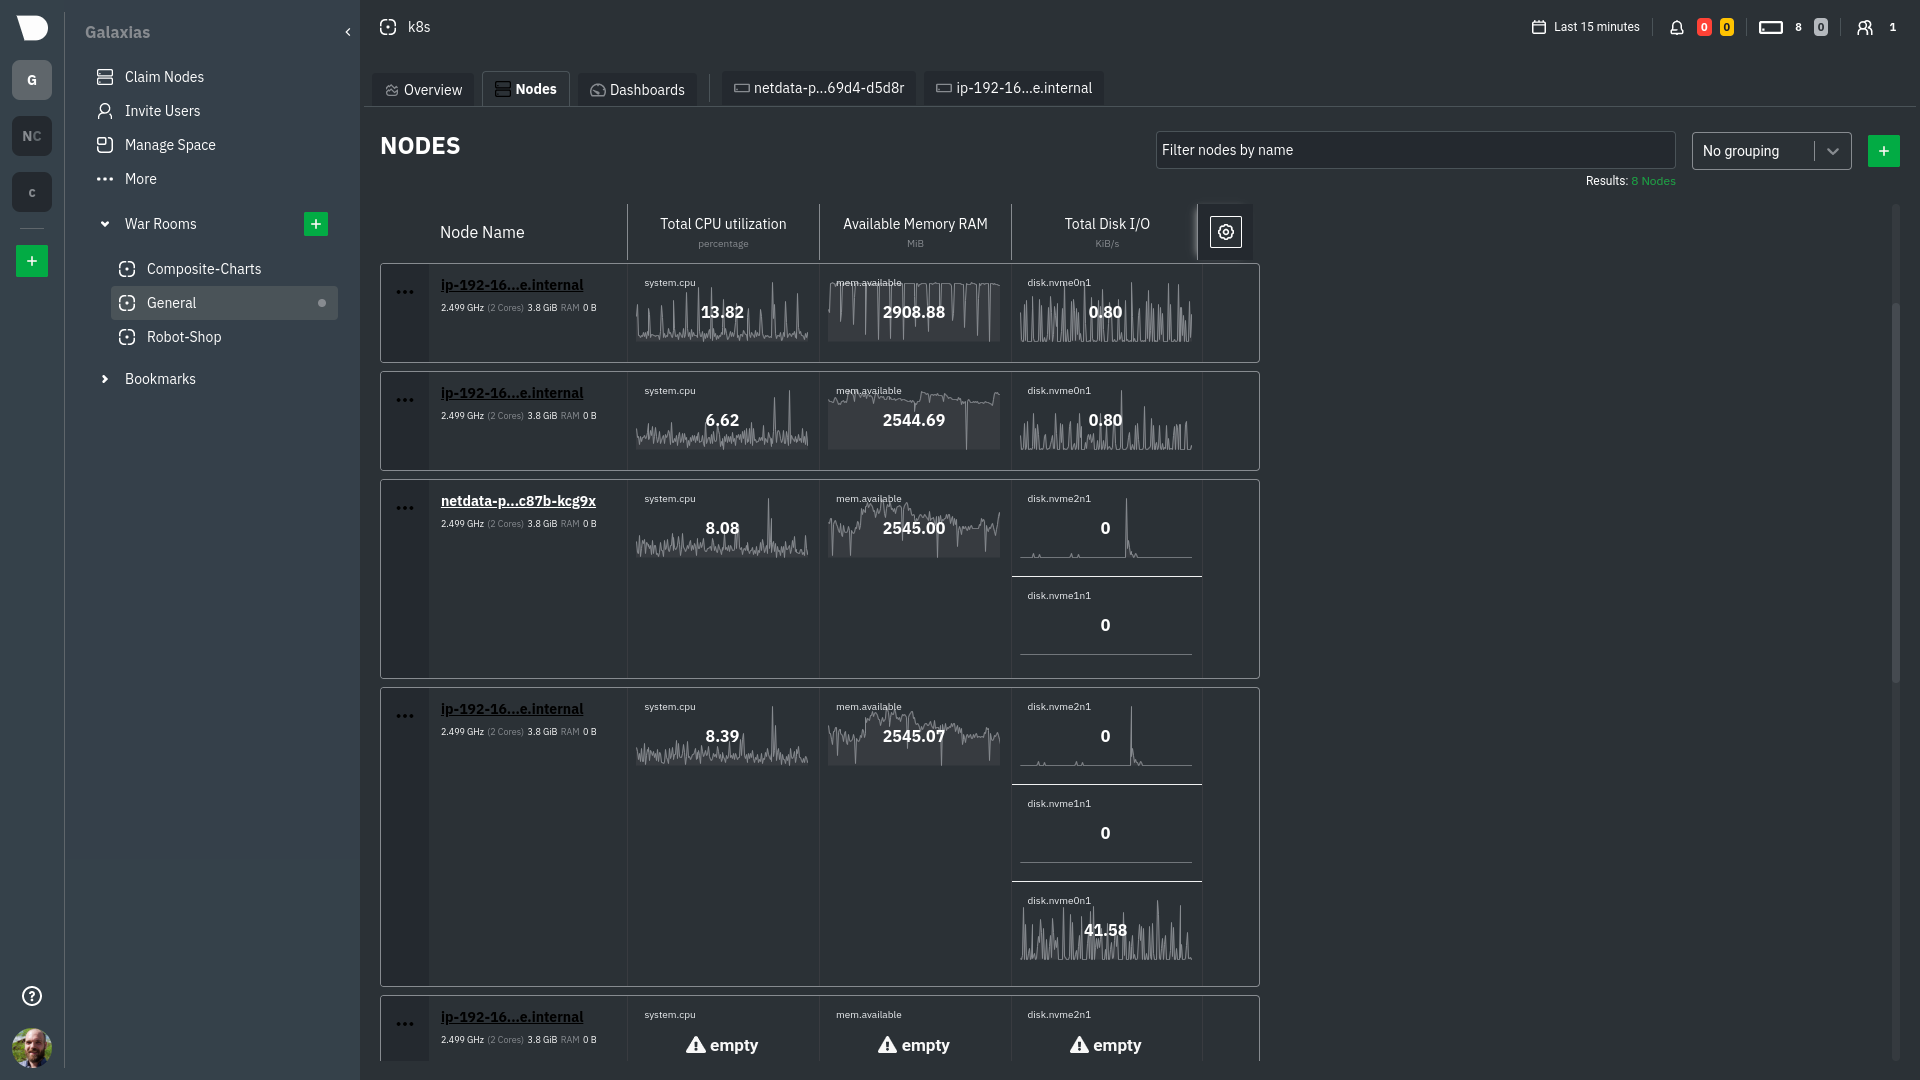 diff --git a/packaging/installer/methods/ansible.md b/packaging/installer/methods/ansible.md index 85c982fa1f..ec4a2565bf 100644 --- a/packaging/installer/methods/ansible.md +++ b/packaging/installer/methods/ansible.md @@ -103,8 +103,8 @@ two different SSH keys supplied by AWS. ### Edit the `vars/main.yml` file -In order to connect your node(s) to your Space in Netdata Cloud, and see all their metrics in real-time in [composite -charts](https://github.com/netdata/netdata/blob/master/docs/visualize/overview-infrastructure.md) or perform [Metric +In order to connect your node(s) to your Space in Netdata Cloud, and see all their metrics in real-time in composite +charts or perform [Metric Correlations](https://github.com/netdata/netdata/blob/master/docs/cloud/insights/metric-correlations.md), you need to set the `claim_token` and `claim_room` variables. |