
diff options
| author | Joel Hans <joel@netdata.cloud> | 2019-12-20 14:58:57 -0700 |
|---|---|---|
| committer | GitHub <noreply@github.com> | 2019-12-20 14:58:57 -0700 |
| commit | 9d754e8ac3530d68dd6a54a2b39668551d5d9956 (patch) | |
| tree | 240600d7969d8cdf4799c1bdf3585baf5e4f4dc1 | |
| parent | 6fcb3e65f12d6c4b6171b37e9622adfbd8a112d9 (diff) | |
The step-by-step Netdata tutorial (#7489)
* Initial add
* Parts to steps
* Lots of fixes to tutorial steps, integration with docs
* Fixing broken links
* checklinks fix
* Add to sidebar
* Initial add
* Parts to steps
* Lots of fixes to tutorial steps, integration with docs
* Fixing broken links
* checklinks fix
* Add to sidebar
* Fixed link
* Added tutorial to homepage with styling
* Cleanup
* Few more fixes and improvements
* Final tweaks to last few steps
* Let nav items wrap
* Fixes for Austin and Andy
* Linter error
* Add text for Austin
* Text about charts not showing up
| -rw-r--r-- | DOCUMENTATION.md | 60 | ||||
| -rwxr-xr-x | docs/generator/buildyaml.sh | 4 | ||||
| -rw-r--r-- | docs/generator/custom/css/netdata.css | 51 | ||||
| -rw-r--r-- | docs/getting-started.md | 7 | ||||
| -rw-r--r-- | docs/step-by-step/step-00.md | 106 | ||||
| -rw-r--r-- | docs/step-by-step/step-01.md | 148 | ||||
| -rw-r--r-- | docs/step-by-step/step-02.md | 210 | ||||
| -rw-r--r-- | docs/step-by-step/step-03.md | 168 | ||||
| -rw-r--r-- | docs/step-by-step/step-04.md | 134 | ||||
| -rw-r--r-- | docs/step-by-step/step-05.md | 341 | ||||
| -rw-r--r-- | docs/step-by-step/step-06.md | 114 | ||||
| -rw-r--r-- | docs/step-by-step/step-07.md | 113 | ||||
| -rw-r--r-- | docs/step-by-step/step-08.md | 388 | ||||
| -rw-r--r-- | docs/step-by-step/step-09.md | 174 | ||||
| -rw-r--r-- | docs/step-by-step/step-10.md | 213 | ||||
| -rw-r--r-- | docs/step-by-step/step-99.md | 44 | ||||
| -rw-r--r-- | packaging/installer/README.md | 14 |
17 files changed, 2261 insertions, 28 deletions
diff --git a/DOCUMENTATION.md b/DOCUMENTATION.md index b3f42dd7d8..dd5cf76254 100644 --- a/DOCUMENTATION.md +++ b/DOCUMENTATION.md @@ -1,26 +1,60 @@ # Netdata Documentation -**Netdata is real-time health monitoring and performance troubleshooting for systems and applications.** It helps you instantly diagnose slowdowns and anomalies in your infrastructure with thousands of metrics, interactive visualizations, and insightful health alarms. +**Netdata is real-time health monitoring and performance troubleshooting for systems and applications.** It helps you +instantly diagnose slowdowns and anomalies in your infrastructure with thousands of metrics, interactive visualizations, +and insightful health alarms. ## Navigating the Netdata documentation -Welcome! You've arrived at the documentation for Netdata. Use the links below to find answers to the most common questions about Netdata, such as how to install it, getting started guides, basic configuration, and adding more charts. Or, explore all of Netdata's documentation using the table of contents to your left. +Welcome! You've arrived at the documentation for Netdata. Use the links below to find answers to the most common +questions about Netdata, such as how to install it, getting started guides, basic configuration, and adding more charts. +Or, explore all of Netdata's documentation using the table of contents to your left. <div class="homepage-nav"> - <div class="nav-install"> - <a class="nav-button" href="packaging/installer/#one-line-installation">One-line installation</a> - <p>Use our completely automated one-line installation process to get Netdata on all Linux distributions. Or, find detailed instructions for binary packages, Kubernetes, macOS, and more.</p> - + <div class="nav-page"> + <a href="packaging/installer/"> + <div class="button-header"> + <h3>Installation guide</h3> + <svg stroke="currentColor" fill="currentColor" stroke-width="0" viewBox="0 0 448 512" height="1em" width="1em" xmlns="http://www.w3.org/2000/svg"><path d="M224.3 273l-136 136c-9.4 9.4-24.6 9.4-33.9 0l-22.6-22.6c-9.4-9.4-9.4-24.6 0-33.9l96.4-96.4-96.4-96.4c-9.4-9.4-9.4-24.6 0-33.9L54.3 103c9.4-9.4 24.6-9.4 33.9 0l136 136c9.5 9.4 9.5 24.6.1 34zm192-34l-136-136c-9.4-9.4-24.6-9.4-33.9 0l-22.6 22.6c-9.4 9.4-9.4 24.6 0 33.9l96.4 96.4-96.4 96.4c-9.4 9.4-9.4 24.6 0 33.9l22.6 22.6c9.4 9.4 24.6 9.4 33.9 0l136-136c9.4-9.2 9.4-24.4 0-33.8z"></path></svg> + </div> + <div class="button-text"> + <p>Use our automated one-line installation script to install Netdata on Linux systems or find detailed instructions for binary packages, Kubernetes, Docker, macOS, and more.</p> + </div> + </a> </div> - <div class="nav-getting-started"> - <a class="nav-button" href="docs/getting-started/">Getting started guide</a> - <p>The perfect place for Netdata beginners to start. Learn how to access Netdata's dashboard, start and stop the service, basic configuration, and more.</p> - + <div class="nav-page"> + <a href="docs/step-by-step/step-00/"> + <div class="button-header"> + <h3>Step-by-step tutorial</h3> + <svg stroke="currentColor" fill="currentColor" stroke-width="0" viewBox="0 0 448 512" height="1em" width="1em" xmlns="http://www.w3.org/2000/svg"><path d="M224.3 273l-136 136c-9.4 9.4-24.6 9.4-33.9 0l-22.6-22.6c-9.4-9.4-9.4-24.6 0-33.9l96.4-96.4-96.4-96.4c-9.4-9.4-9.4-24.6 0-33.9L54.3 103c9.4-9.4 24.6-9.4 33.9 0l136 136c9.5 9.4 9.5 24.6.1 34zm192-34l-136-136c-9.4-9.4-24.6-9.4-33.9 0l-22.6 22.6c-9.4 9.4-9.4 24.6 0 33.9l96.4 96.4-96.4 96.4c-9.4 9.4-9.4 24.6 0 33.9l22.6 22.6c9.4 9.4 24.6 9.4 33.9 0l136-136c9.4-9.2 9.4-24.4 0-33.8z"></path></svg> + </div> + <div class="button-text"> + <p>Take a guided tour through each of Netdata's core features—perfect for beginners. Follow detailed instructions to monitor your systems and apps, and start your journey into performance troubleshooting.</p> + </div> + </a> + </div> + <div class="nav-page"> + <a href="docs/getting-started/"> + <div class="button-header"> + <h3>Getting started guide</h3> + <svg stroke="currentColor" fill="currentColor" stroke-width="0" viewBox="0 0 448 512" height="1em" width="1em" xmlns="http://www.w3.org/2000/svg"><path d="M224.3 273l-136 136c-9.4 9.4-24.6 9.4-33.9 0l-22.6-22.6c-9.4-9.4-9.4-24.6 0-33.9l96.4-96.4-96.4-96.4c-9.4-9.4-9.4-24.6 0-33.9L54.3 103c9.4-9.4 24.6-9.4 33.9 0l136 136c9.5 9.4 9.5 24.6.1 34zm192-34l-136-136c-9.4-9.4-24.6-9.4-33.9 0l-22.6 22.6c-9.4 9.4-9.4 24.6 0 33.9l96.4 96.4-96.4 96.4c-9.4 9.4-9.4 24.6 0 33.9l22.6 22.6c9.4 9.4 24.6 9.4 33.9 0l136-136c9.4-9.2 9.4-24.4 0-33.8z"></path></svg> + </div> + <div class="button-text"> + <p>Have some monitoring and system administration experience? Dive right into configuring Netdata, accessing the dashboard, working with the daemon, and changing how Netdata stores metrics.</p> + </div> + </a> </div> - <div class="nav-configuration"> - <a class="nav-button" href="docs/configuration-guide/">Configuration guide</a> - <p>Take your configuration options from the <em>getting started guide</em> to the next level. Increase metrics retention, modify how charts are displayed, disable collectors, and modify alarms.</p> + <div class="nav-page"> + <a href="docs/configuration-guide/"> + <div class="button-header"> + <h3>Configuration guide</h3> + <svg stroke="currentColor" fill="currentColor" stroke-width="0" viewBox="0 0 448 512" height="1em" width="1em" xmlns="http://www.w3.org/2000/svg"><path d="M224.3 273l-136 136c-9.4 9.4-24.6 9.4-33.9 0l-22.6-22.6c-9.4-9.4-9.4-24.6 0-33.9l96.4-96.4-96.4-96.4c-9.4-9.4-9.4-24.6 0-33.9L54.3 103c9.4-9.4 24.6-9.4 33.9 0l136 136c9.5 9.4 9.5 24.6.1 34zm192-34l-136-136c-9.4-9.4-24.6-9.4-33.9 0l-22.6 22.6c-9.4 9.4-9.4 24.6 0 33.9l96.4 96.4-96.4 96.4c-9.4 9.4-9.4 24.6 0 33.9l22.6 22.6c9.4 9.4 24.6 9.4 33.9 0l136-136c9.4-9.2 9.4-24.4 0-33.8z"></path></svg> + </div> + <div class="button-text"> + <p>Take your configuration options from the <em>getting started guide</em> to the next level. Increase metrics retention, modify how charts are displayed, disable collectors, and modify alarms.</p> + </div> + </a> </div> </div> diff --git a/docs/generator/buildyaml.sh b/docs/generator/buildyaml.sh index 133aa3bf0f..73c3295697 100755 --- a/docs/generator/buildyaml.sh +++ b/docs/generator/buildyaml.sh @@ -150,6 +150,10 @@ echo -ne " - 'docs/what-is-netdata.md' - 'packaging/DISTRIBUTIONS.md' - 'packaging/installer/UNINSTALL.md' - 'docs/getting-started.md' +" +navpart 1 docs/step-by-step "" "Step-by-step tutorial" 1 +# navpart 1 health README "Alarms and notifications" +echo -ne " - Running Netdata: - 'daemon/README.md' - 'docs/configuration-guide.md' diff --git a/docs/generator/custom/css/netdata.css b/docs/generator/custom/css/netdata.css index 7b1934db48..e4d292fd77 100644 --- a/docs/generator/custom/css/netdata.css +++ b/docs/generator/custom/css/netdata.css @@ -1,6 +1,6 @@ -.md-nav__link { +/* .md-nav__link { white-space: nowrap; -} +} */ .md-typeset { font-size: .75rem @@ -15,20 +15,53 @@ /* Custom styling for the new documentation homepage. In particular, the three buttons for install/getting started/configuration. */ .homepage-nav { - display: flex; + display: grid; + grid-template-columns: repeat(4,[col-start] 1fr); + grid-gap: 2rem; margin-top: 1.4rem; + margin-bottom: 2rem; } -.homepage-nav div { - flex: 1; +.nav-page { + grid-column: span 2; + border-radius: 3px; + border: 1px solid #EFEFEF; + box-shadow: 0 8px 48px 4px rgba(86,91,115,0.15); } -.homepage-nav .nav-install { - margin-right: 1rem; +.button-header { + padding: 1rem 1.4rem; + display: flex; + align-items: center; + justify-content: space-between; + background: linear-gradient( to right, #306BAC, #56B2FF 140%); + border-radius: 3px 3px 0 0; } -.homepage-nav .nav-configuration { - margin-left: 1rem; +.button-header h3 { + color: white; + margin: 0; +} + +.button-header svg { + color: white; + position: relative; + transition-property: left; + transition-timing-function: ease-in-out; + transition-duration: 200ms; +} + +.nav-page:hover svg { + left: 4px; +} + +.button-text { + color: #35414A; + padding: 1rem 1.4rem; +} + +.button-text p { + margin: 0; } .nav-button { diff --git a/docs/getting-started.md b/docs/getting-started.md index 682b8847eb..eca94df337 100644 --- a/docs/getting-started.md +++ b/docs/getting-started.md @@ -1,11 +1,14 @@ # Getting started guide -Thanks for trying Netdata! In this guide, we'll quickly walk you through the first steps you should take after getting -Netdata installed. +Thanks for trying Netdata! In this getting started guide, we'll quickly walk you through the first steps you should take +after getting Netdata installed. Netdata can collect thousands of metrics in real-time without any configuration, but there are some valuable things to know to get the most of out Netdata based on your needs. +We'll skip right into some technical details, so if you're brand-new to monitoring the health and performance of systems +and applications, our [**step-by-step tutorial**](step-by-step/step-00.md) might be a better fit. + > If you haven't installed Netdata yet, visit the [installation instructions](../packaging/installer) for details, > including our one-liner script, which automatically installs Netdata on almost all Linux distributions. diff --git a/docs/step-by-step/step-00.md b/docs/step-by-step/step-00.md new file mode 100644 index 0000000000..f8f95aed09 --- /dev/null +++ b/docs/step-by-step/step-00.md @@ -0,0 +1,106 @@ +# The step-by-step Netdata tutorial + +Welcome to Netdata! We're glad you're interested in our health monitoring and performance troubleshooting system. + +Because Netdata is entirely open-source software, you can use it free of charge, whether you want to monitor one or ten +thousand systems! All our code is hosted on [GitHub](https://github.com/netdata/netdata). + +This tutorial is designed to help you understand what Netdata is, what it's capable of, and how it'll help you make +faster and more informed decisions about the health and performance of your systems and applications. If you're +completely new to Netdata, or have never tried health monitoring/performance troubleshooting systems before, this +tutorial is perfect for you. + +If you have monitoring experience, or would rather get straight into configuring Netdata to your needs, you can jump +straight into code and configurations with our [getting started guide](../getting-started.md). + +> This tutorial contains instructions for Netdata installed on a Linux system. Many of the instructions will work on +> other supported operating systems, like FreeBSD and MacOS, but we can't make any guarantees. + +## Where to go if you need help + +No matter where you are in this Netdata tutorial, if you need help, head over to our [GitHub +repository](https://github.com/netdata/netdata/). That's where we collect questions from users, help fix their bugs, and +point people toward documentation that explains what they're having trouble with. + +Click on the **issues** tab to see all the conversations we're having with Netdata users. Use the search bar to find +previously-written advice for your specific problem, and if you don't see any results, hit the **New issue** button to +send us a question. + +Or, if that's too complicated, feel free to send this tutorial's author [an email](mailto:joel@netdata.cloud). + +## Before we get started + +Let's make sure you have Netdata installed on your system! + +> If you already installed Netdata, feel free to skip to [Step 1: Netdata's building blocks](step-01.md). + +The easiest way to install Netdata on a Linux system is our `kickstart.sh` one-line installer. Run this on your system +and let it take care of the rest. + +This script will install Netdata from source, keep it up to date with nightly releases, connects to the Netdata +[registry](../../registry/README.md), and sends [_anonymous statistics_](../anonymous-statistics.md) about how you use +Netdata. We use this information to better understand how we can improve the Netdata experience for all our users. + +```bash +bash <(curl -Ss https://my-netdata.io/kickstart.sh) +``` + +Once finished, you'll have Netdata installed, and you'll be set up to get _nightly updates_ to get the latest features, +improvements, and bugfixes. + +If this method doesn't work for you, or you want to use a different process, visit our [installation +documentation](../../packaging/installer/README.md) for details. + +## Netdata fundamentals + +[Step 1. Netdata's building blocks](step-01.md) + +In this introductory step, we'll talk about the fundamental ideas, philosophies, and UX decisions behind Netdata. + +[Step 2. Get to know Netdata's dashboard](step-02.md) + +Visit Netdata's dashboard to explore, manipulate charts, and check out alarms. Get your first taste of visual anomaly +detection. + +[Step 3. Monitor more than one system with Netdata](step-03.md) + +While the dashboard lets you quickly move from one agent to another, Netdata Cloud is our SaaS solution for monitoring +the health of many systems. We'll cover its features and the benefits of using Netdata Cloud on top of the dashboard. + +[Step 4. The basics of configuring Netdata](step-04.md) + +While Netdata can monitor thousands of metrics in real-time without any configuration, you may _want_ to tweak some +settings based on your system's resources. + +## Intermediate steps + +[Step 5. Health monitoring alarms and notifications](step-05.md) + +Learn how to tune, silence, and write custom alarms. Then enable notifications so you never miss a change in health +status or performance anomaly. + +[Step 6. Collect metrics from more services and apps](step-06.md) + +Learn how to enable/disable collection plugins and configure a collection plugin job to add more charts to your Netdata +dashboard and begin monitoring more apps and services, like MySQL, Nginx, MongoDB, and hundreds more. + +[Step 7. Netdata's dashboard in depth](step-07.md) + +Now that you configured your Netdata monitoring agent to your exact needs, you'll dive back into metrics snapshots, +updates, and the dashboard's settings. + +## Advanced steps + +[Step 8. Building your first custom dashboard](step-08.md) + +Using simple HTML, CSS, and JavaScript, we'll build a custom dashboard that displays essential information in any format +you choose. You can even monitor many systems from a single HTML file. + +[Step 9. Long-term metrics storage](step-09.md) + +Want to store lots of real-time metrics from Netdata? Tweak our custom database to your heart's content. Want to take +your Netdata metrics elsewhere? We're happy to help you archive data to Prometheus, MongoDB, TimescaleDB, and others. + +[Step 10. Set up a proxy](step-10.md) + +Run Netdata behind an Nginx proxy to improve performance, and enable TLS/HTTPS for better security. diff --git a/docs/step-by-step/step-01.md b/docs/step-by-step/step-01.md new file mode 100644 index 0000000000..fedf3ea0e2 --- /dev/null +++ b/docs/step-by-step/step-01.md @@ -0,0 +1,148 @@ +# Step 1. Netdata's building blocks + +Netdata is a distributed and real-time _health monitoring and performance troubleshooting toolkit_ for monitoring your +systems and applications. + +Because the monitoring agent is highly-optimized, you can install it all your physical systems, containers, IoT devices, +and edge devices without disrupting their core function. + +By default, and without configuration, Netdata delivers real-time insights into everything happening on the system, from +CPU utilization to packet loss on every network device. Netdata can also auto-detect metrics from hundreds of your +favorite services and applications, like MySQL/MariaDB, Docker, Nginx, Apache, MongoDB, and more. + +All metrics are automatically-updated, providing interactive dashboards that allow you to dive in, discover anomalies, +and figure out the root cause analysis of any issue. + +Best of all, Netdata is entirely free, open-source software! Solo developers and enterprises with thousands of systems +can both use it free of charge. We're hosted on [GitHub](https://github.com/netdata/netdata). + +Want to learn about the history of Netdata, and what inspired our CEO to build it in the first place, and where we're +headed? Read Costa's comprehensive blog post: _[Redefining monitoring with Netdata (and how it came to +be)](https://blog.netdata.cloud/posts/redefining-monitoring-netdata/)_. + +## What you'll learn in this step + +In the first step of the Netdata guide, you'll learn about: + +- [Netdata's core features](#netdatas-core-features) +- [Why you should use Netdata](#why-you-should-use-netdata) +- [How Netdata has complementary systems, not competitors](#how-netdata-has-complementary-systems-not-competitors) + +Let's get started! + +## Netdata's core features + +Netdata has only been around for a few years, but it's a complex piece of software. Here are just some of the features +we'll cover throughout this tutorial. + +- A sophisticated **dashboard**, which we'll cover in [step 2](step-02.md). The real-time, highly-granular dashboard, + with hundreds of charts, is your main source of information about the health and performance of your systems/ + applications. We designed the dashboard with anomaly detection and quick analysis in mind. We'll return to + dashboard-related topics in both [step 7](step-07.md) and [step 8](step-08.md). +- **Netdata Cloud** is our SaaS toolkit that helps Netdata users monitor the health and performance of entire + infrastructures, whether they are two or two thousand (or more!) systems. We'll cover Netdata Cloud in [step + 3](step-03.md). +- **No configuration necessary**. Without any configuration, you'll get thousands of real-time metrics and hundreds of + alarms designed by our community of sysadmin experts. But you _can_ configure Netdata in a lot of ways, some of + which we'll cover in [step 4](step-04.md). +- **Distributed, per-system installation**. Instead of centralizing metrics in one location, you install Netdata on + _every_ system, and each system is responsible for its metrics. Having distributed agents reduces cost and lets + Netdata run on devices with little available resources, such as IoT and edge devices, without affecting their core + purpose. +- **Sophisticated health monitoring** to ensure you always know when an anomaly hits. In [step 5](step-05.md), we dive + into how you can tune alarms, write your own alarm, and enable two types of notifications. +- **High-speed, low-resource collectors** that allow you to collect thousands of metrics every second while using only + a fraction of your system's CPU resources and a few MiB of RAM. +- **Long-term metrics storage**. With our new database engine, you can store days, weeks, or months of per-second + historical metrics. Or you can archive metrics to another database, like MongoDB or Prometheus. We'll cover all + these options in [step 9](step-09.md). + +## Why you should use Netdata + +Because you care about the health and performance of your systems and applications, and all of the awesome features we +just mentioned. And it's free! + +All these may be valid reasons, but let's step back and talk about Netdata's _principles_ for health monitoring and +performance troubleshooting. We have a lot of [complementary +systems](#how-netdata-has-complementary-systems-not-competitors), and we think there's a good reason why Netdata should +always be your first choice when troubleshooting an anomaly. + +We built Netdata on four principles. + +### Per-second data collection + +Our first principle is per-second data collection for all metrics. + +That matters because you can't monitor a 2-second service-level agreement (SLA) with 10-second metrics. You can't detect +quick anomalies if your metrics don't show them. + +How do we solve this? By decentralizing monitoring. Each node is responsible for collecting metrics, triggering alamrs, +and building dashboards locally, and we work hard to ensure it does each step (and others) with remarkable efficiency. +For example, Netdata can [collect 100,000 metrics](https://github.com/netdata/netdata/issues/1323) every second while +using only 9% of a single server-grade CPU core! + +By decentralizing monitoring and emphasizing speed at every turn, Netdata helps you scale your health monitoring and +performance troubleshooting to an infrastructure of every size. _And_ you get to keep per-second metrics. + +### Unlimited metrics + +We believe all metrics are fundamentally important, and all metrics should be available to the user. + +If you don't collect _all_ the metrics a system creates, you're only seeing part of the story. It's like saying you've +read a book after skipping all but the last ten pages. You only know the ending, not everything that leads to it. + +Most monitoring solutions exist to poke you when there's a problem, and then tell you to use a dozen different console +tools to find the root cause. Netdata prefers to give you every piece of information you might need to understand why an +anomaly happened. + +### Meaningful presentation + +We want every piece of Netdata's dashboard not only to look good and update every second, but also provide context as to +what you're looking at and why it matters. + +The principle of meaningful presentation is fundamental to our dashboard's user experience (UX). We could have put +charts in a grid or hidden some behind tabs or buttons. We instead chose to stack them vertically, on a single page, so +you can visually see how, for example, a jump in disk usage can also increase system load. + +Here's an example of a system undergoing a disk stress test: + +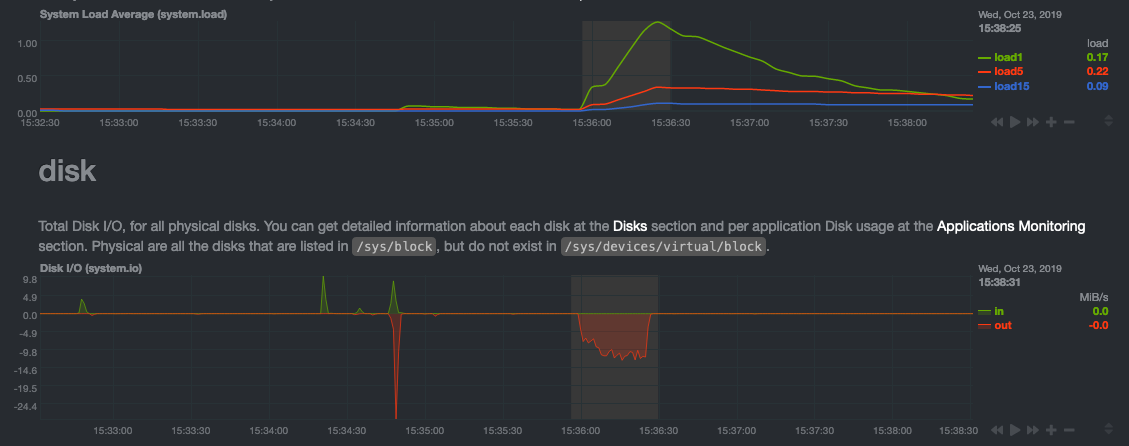 + +> For the curious, here's the command: `stress-ng --fallocate 4 --fallocate-bytes 4g --timeout 1m --metrics --verify +> --times`! + +### Immediate results + +Finally, Netdata should be usable from the moment you install it. + +As we've talked about, and as you'll learn in the following nine steps, Netdata comes installed with: + +- Auto-detected metrics +- Human-readable units +- Metrics that are structured into charts, families, and contexts +- Automatically generated dashboards +- Charts designed for visual anomaly detection +- Hundreds of pre-configured alarms + +By standardizing your monitoring infrastructure, Netdata tries to make at least one part of your administrative tasks +easy! + +## How Netdata has complementary systems, not competitors + +We'll cover this quickly, as you're probably eager to get on with using Netdata itself. + +We don't want to lock you in to using Netdata by itself, and forever. By supporting [archiving to +backends](../../backends/README.md) like Graphite, Prometheus, OpenTSDB, MongoDB, and others, you can use Netdata _in +conjunction_ with software that might seem like our competitors. + +We don't want to "wage war" with another monitoring solution, whether it's commercial, open-source, or anything in +between. We just want to give you all the metrics every second, and what you do with them next is your business, not +ours. Our mission is helping people create more extraordinary infrastructures! + +## What's next? + +We think it's imperative you understand why we built Netdata the way we did. But now that we have that behind us, let's +get right into that dashboard you've heard so much about. + +[Next: Get to know Netdata's dashboard →](step-02.md) diff --git a/docs/step-by-step/step-02.md b/docs/step-by-step/step-02.md new file mode 100644 index 0000000000..c9a0b120e5 --- /dev/null +++ b/docs/step-by-step/step-02.md @@ -0,0 +1,210 @@ +# Step 2. Get to know Netdata's dashboard + +Welcome to Netdata proper! Now that you understand how Netdata works, how it's built, and why we built it, you can start +working with the dashboard directly. + +This step-by-step guide assumes you've already installed Netdata on a system of yours. If you haven't yet, hop back over +to ["step 0"](step-00.md#before-we-get-started) for information about our one-line installer script. Or, view the +[installation docs](../../packaging/installer) to learn more. Once you have Netdata installed, you can hop back over +here and dig in. + +## What you'll learn in this step + +In this step of the Netdata guide, you'll learn how to: + +- [Visit and explore the dashboard](#visit-and-explore-the-dashboard) +- [Explore available charts using menus](#explore-available-charts-using-menus) +- [Read the descriptions accompanying charts](#read-the-descriptions-accompanying-charts) +- [Interact with charts](#interact-with-charts) +- [See raised alarms and the alarm log](#see-raised-alarms-and-the-alarm-log) + +Let's get started! + +## Visit and explore the dashboard + +Netdata's dashboard is where you interact with your system's metrics. Time to open it up and start exploring. Open up +your browser of choice. + +If you installed Netdata on the same system you're using to open your browser, navigate to `http://localhost:19999/`. + +If you installed Netdata on a remote system, navigate to `http://HOST:19999/` after replacing `HOST` with the IP address +of that system. To connect to a virtual private server (VPS), for example, you might navigate to +`http://203.0.113.0:19999`. We'll learn more on monitoring remote systems and [multiple systems](step-03.md) +later on. + +> From here on out in this tutorial, we'll refer to the address you use to view your dashboard as `HOST`. Be sure to +> replace it with either `localhost` or the IP address as needed. + +Hit `Enter`. Welcome to Netdata! + + + +## Explore available charts using menus + +**Menus** are located on the right-hand side of the Netdata dashboard. You can use these to navigate to the +charts you're interested in. + + + +Netdata shows all its charts on a single page, so you can also scroll up and down using the mouse wheel, your +touchscreen/touchpad, or the scrollbar. + +Both menus and the items displayed beneath them, called **submenus**, are populated automatically by Netdata based on +what it's collecting. If you run Netdata on many different systems using different OS types or versions, the +menus and submenus may look a little different for each one. + +To learn more about menus, see our documentation about [navigating the standard +dashboard](../../web/gui/README.md#menus). + +> ❗ By default, Netdata only creates and displays charts if the metrics are _not zero_. So, you may be missing some +> charts, menus, and submenus if those charts have zero metrics. You can change this by changing the **Which dimensions +> to show?** setting to **All**. In addition, if you start Netdata and immediately load the dashboard, not all +> charts/menus/submenus may be displayed, as some collectors can take a while to initialize. + +## Read the descriptions accompanying charts + +Many charts come with a short description of what dimensions the chart is displaying and why they matter. + +For example, here's the description that accompanies the **swap** chart. + +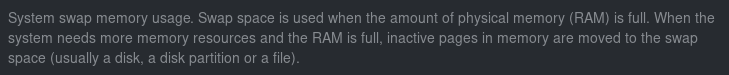 + +If you're new to health monitoring and performance troubleshooting, we recommend you spend some time reading these +descriptions and learning more at the pages linked above. + +## Understand charts, dimensions, families, and contexts + +A **chart** is an interactive visualization of one or more collected/calculated metrics. You can see the name (also +known as its unique ID) of a chart by looking at the top-left corner of a chart and finding the parenthesized text. On a +Linux system, one of the first charts on the dashboard will be the system CPU chart, with the name `system.cpu`: + + + +A **dimension** is any value that gets shown on a chart. The value can be raw data or calculated values, such as +percentages, aggregates, and more. Most charts will have more than one dimension, in which case it will display each in +a different color. Here, a `system.cpu` chart is showing many dimensions, such as `user`, `system`, `softirq`, `irq`, +and more. + +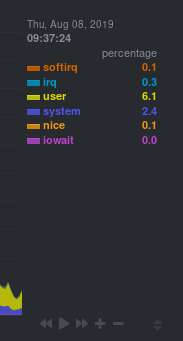 + +A **family** is _one_ instance of a monitored hardware or software resource that needs to be monitored and displayed +separately from similar instances. For example, if your system has multiple partitions, Netdata will create different +families for `/`, `/boot`, `/home`, and so on. Same goes for entire disks, network devices, and more. + +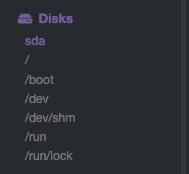 + +A **context** groups several charts based on the types of metrics being collected and displayed. For example, the +**Disk** section often has many contexts: `disk.io`, `disk.ops`, `disk.backlog`, `disk.util`, and so on. Netdata uses +this context to create individual charts and then groups them by family. You can always see the context of any chart by +looking at its name or hovering over the chart's date. + +It's important to understand these differences, as Netdata uses charts, dimensions, families, and contexts to create +health alarms and configure collectors. To read even more about the differences between all these elements of the +dashboard, and how they affect other parts of Netdata, read our [dashboards +documentation](../../web/README.md#charts-contexts-families). + +## Interact with charts + +We built Netdata to be a big sandbox for learning more about your systems and applications. Time to play! + +Netdata's charts are fully interactive. You can pan through historical metrics, zoom in and out, select specific +timeframes for further analysis, resize charts, and more. + +Best of all, Whenever you use a chart in this way, Netdata synchronizes all the other charts to match it. This even +applies across different Netdata agents if you connect them using the [**My nodes** menu](../../registry/README.md)! + + + +### Pan, zoom, highlight, and reset charts + +You can change how charts show their metrics in a few different ways, each of which have a few methods: + +| Change | Method #1 | Method #2 | Method #3 | +| ------------------------------------------------- | ----------------------------------- | --------------------------------------------------------- | ---------------------------------------------------------- | +| **Reset** charts to default auto-refreshing state | `double click` | `double tap` (touchpad/touchscreen) | | +| **Select** a certain timeframe | `ALT` + `mouse selection` | `⌘` + `mouse selection` (macOS) | | +| **Pan** forward or back in time | `click and drag` | `touch and drag` (touchpad/touchscreen) | | +| **Zoom** to a specific timeframe | `SHIFT` + `mouse selection` | | | +| **Zoom** in/out | `SHIFT`/`ALT` + `mouse scrollwheel` | `SHIFT`/`ALT` + `two-finger pinch` (touchpad/touchscreen) | `SHIFT`/`ALT` + `two-finger scroll` (touchpad/touchscreen) | + +These interactions can also be triggered using the icons on the bottom-right corner of every chart. They are, +respectively, `Pan Left`, `Reset`, `Pan Right`, `Zoom In`, and `Zoom Out`. + + + +### Show and hide dimensions + +Each dimension can be hidden by clicking on it. Hiding dimensions simplifies the chart and can help you better discover +exactly which aspect of your system is behaving strangely. + +### Resize charts + +Additionally, resize charts by clicking-and-dragging the icon on the bottom-right corner of any chart. To restore the +chart to its original height, double-click the same icon. + + + +To learn more about other options and chart interactivity, read our [dashboard documentation](../../web/README.md). + +## See rai |