
diff options
| author | Danglewood <85772166+deeleeramone@users.noreply.github.com> | 2024-04-19 08:14:46 -0700 |
|---|---|---|
| committer | GitHub <noreply@github.com> | 2024-04-19 15:14:46 +0000 |
| commit | fe0debe12c2bd6854f3789016707b0b00bbca3df (patch) | |
| tree | 6768b712b7337c15594204eed07f3418d6fed42f | |
| parent | 6cfc47541ab51159d5e9761774e4c415ce4c36e6 (diff) | |
[Docs] Charting Documentation (#6303)
* start to charting docs
* Add images to landing page
* Add images to indicators
* codespell
* add some examples
* Add screenshots
* codespell
* missing image
6 files changed, 986 insertions, 46 deletions
diff --git a/website/content/platform/extensions/charting/_category_.json b/website/content/platform/extensions/charting/_category_.json new file mode 100644 index 00000000000..bbcd6d4e083 --- /dev/null +++ b/website/content/platform/extensions/charting/_category_.json @@ -0,0 +1,4 @@ +{ + "label": "Charting", + "position": 3 +}
\ No newline at end of file diff --git a/website/content/platform/extensions/charting/examples.md b/website/content/platform/extensions/charting/examples.md new file mode 100644 index 00000000000..87b9918ceed --- /dev/null +++ b/website/content/platform/extensions/charting/examples.md @@ -0,0 +1,165 @@ +--- +title: Examples +sidebar_position: 1 +description: This page provides examples of creating charts with the `openbb-charting` extension. +keywords: +- tutorial +- OpenBB Platform +- Python client +- Fast API +- getting started +- extensions +- charting +- view +- Plotly +- toolkits +- how-to +- generic +- figure +--- + +import HeadTitle from '@site/src/components/General/HeadTitle.tsx'; + +<HeadTitle title="Examples - OpenBB Charting - Extensions | OpenBB Platform Docs" /> + +## Overview + +This page will walk through creating different charts using the `openbb-charting` extension. +The perspective for this content is from the the Python Interface, +and the examples will assume that the OpenBB Platform is installed with all optional packages. + +```python +from datetime import datetime, timedelta +from openbb import obb +``` + +## Cumulative Returns + +The historical (equity) prices can be requested for multiple symbols. +The extension will attempt to handle variations accordingly. +By default, more than three symbols will draw the chart as cumulative returns from the beginning of the series. + +### Default View + +The tickers below are a collection of State Street Global Advisors SPDR funds, representing S&P 500 components. +The data is looking back five years. + +``` +SPDRS = [ + "SPY", + "XLE", + "XLB", + "XLI", + "XHB", + "XLP", + "XLY", + "XRT", + "XLF", + "XLV", + "XLK", + "XLC", + "XLU", + "XLRE", +] +start_date = (datetime.now() - timedelta(weeks=52*5)).date() +spdrs = obb.equity.price.historical(SPDRS, start_date=start_date, provider="yfinance", chart=True) + +spdrs.show() +``` + + + +### Redraw as YTD + +The `charting` attribute of the command output has methods for creating the chart again. +The `data` parameter allows modifications to the data before creating the figure. +In this example, the length of the data is trimmed to the beginning of the year. + +```python +new_data = spdrs.to_df().loc[datetime(2023,12,29).date():] +spdrs.charting.to_chart(data=new_data, title="YTD") +``` + +:::note +This replaces the chart that was already created. +::: + + + +## Price Performance Bar Chart + +The `obb.equity.price.performance` endpoint will create a bar chart over intervals. + +```python +price_performance = obb.equity.price.performance(SPDRS, chart=True) +price_performance.show() +``` + + + +### Create Bar Chart + +This example uses the `create_bar_chart()` method, which does not replace the existing chart, in `price_performance.chart`. +It isolates the one-month performance and orients the layout as horizontal. + +```python +new_data = price_performance.to_df().set_index("symbol").multiply(100).reset_index() +price_performance.charting.create_bar_chart( + data=new_data, + x="symbol", + y="one_month", + orientation="h", + title="One Month Price Performance", + xtitle="Percent (%)" +) +``` + + + +## Create Your Own + +This example analyzes the share volume turnover of the S&P 500 Energy Sector constituents, year-to-date. + +```python +symbols = [ + 'XOM', + 'CVX', + 'COP', + 'EOG', + 'MPC', + 'SLB', + 'PSX', + 'PXD', + 'VLO', + 'WMB', + 'OKE', + 'OXY', + 'HES', + 'FANG', + 'HAL', + 'KMI', + 'DVN', + 'BKR', + 'TRGP', + 'CTRA', + 'MRO', + 'EQT', + 'APA' +] +data = obb.equity.price.historical(symbols, start_date="2024-01-01", provider="yfinance") +create_bar_chart = data.charting.create_bar_chart +volume = data.to_df().groupby("symbol").sum()["volume"] +shares = obb.equity.profile( + symbols, provider="yfinance" +).to_df().set_index("symbol")["shares_float"] +df = volume.to_frame().join(shares) +df["Turnover"] = (df.shares_float/df.volume).round(4) +df = df.sort_values(by="Turnover", ascending=False).reset_index() +create_bar_chart( + data=df, + x="symbol", + y="Turnover", + title="S&P Energy Sector YTD Turnover Rate", +) +``` + diff --git a/website/content/platform/extensions/charting/index.md b/website/content/platform/extensions/charting/index.md new file mode 100644 index 00000000000..f55bbe6a8fe --- /dev/null +++ b/website/content/platform/extensions/charting/index.md @@ -0,0 +1,358 @@ +--- +title: OpenBB Charting +sidebar_position: 1 +description: This page introduces the optional openbb-charting extension. +keywords: +- explanation +- OpenBB Platform +- Python client +- Fast API +- getting started +- extensions +- charting +- view +- Plotly +- toolkits +- community +- Plotly +- OpenBBFigure +- PyWry +--- + +import HeadTitle from '@site/src/components/General/HeadTitle.tsx'; + +<HeadTitle title="OpenBB Charting - Extensions | OpenBB Platform Docs" /> + +## Overview + +The `openbb-charting` extension provides elements for building and displaying interactive charts, tables, dashboards, and more, directly from the OpenBB Platform's Python Interface and FAST API. + +It allows users to create a custom view, without any previous experience working with Plotly, from any response served by the OpenBB Platform. + +The Python Interface includes a custom [PyWry](https://github.com/OpenBB-finance/pywry) backend for displaying any content, in a WebKit HTML window served over `localhost`. In an IDE setting, they will be rendered inline. + +To install, follow the instructions [here](installation). The sections below provide a general explanation of the extension. + +## How Does It Work? + +It works by extending the `OBBject` class with a new attribute, `charting`. When it is installed, every response from the OpenBB Platform will be equipped with these tools. + +For functions that have pre-defined views, it serves as an intermediary between the user request and the response, activated when `chart=True`. When a chart is created, it will populate the existing, `chart`, attribute of the `OBBject`. This is where it is served by the FAST API from the function request. In the Python Interface, charts can be generated post-request, regardless of `chart=True`. + +The `chart` attribute in the OBBject contains three items, responses from the API have two: + +- `fig`: The OpenBBFigure object - an extended Plotly GraphObjects class. Not included in the API response. +- `content`: The Plotly JSON representation of the chart - Returned to the API. +- `format`: The format of the chart - 'plotly' is currently the only charting library. + +There is one OBBject class method, `show()`, which will display the contents of the `chart` attribute, if populated. + +The new `charting` attribute that binds to the OBBject also has a `show()` method. This differs in that it overwrites the existing chart, effectively a 'reset' for the view. + +The extension has a docstring, and it lists the class methods within `charting`. + +```python +from openbb import obb +data = obb.equity.price.historical("AAPL") +data.charting? +``` + +```console +Charting extension. + +Methods +------- +show + Display chart and save it to the OBBject. +to_chart + Redraw the chart and save it to the OBBject, with an optional entry point for Data. +functions + Return a list of Platform commands with charting functions. +get_params + Return the charting parameters for the function the OBBject was created from. +indicators + Return the list of the available technical indicators to use with the `to_chart` method and OHLC+V data. +table + Display an interactive table. +create_line_chart + Create a line chart from external data. +create_bar_chart + Create a bar chart, on a single x-axis with one or more values for the y-axis, from external data. +``` + +:::note +When creating a chart directly from the OpenBB Platform endpoint, chart parameters must be passed as a nested dictionary under the name, `chart_params`. + +```python +chart_params = dict( + title="AAPL 50/200 Day EMA", + indicators=dict( + ema=dict(length=[50,200]), + ), +) +params = dict( + symbol="AAPL", + start_date="2022-01-01", + provider="yfinance", + chart=True, + chart_params=chart_params, +) +data = obb.equity.price.historical(**params) +``` + +`chart_params` are sent in the body of the request when using the API. +::: + +Passing only `chart=True` will return a default view which can be modified and drawn again post-request, via the `OBBject`. + +```console +OBBject + +id: 06614d74-7443-7201-8000-a65f358136a3 +results: [{'date': datetime.date(2022, 1, 3), 'open': 177.8300018310547, 'high': 18... +provider: yfinance +warnings: None +chart: {'content': {'data': [{'close': [182.00999450683594, 179.6999969482422, 174.... +extra: {'metadata': {'arguments': {'provider_choices': {'provider': 'yfinance'}, 's... +``` + +```python +data.show() +``` + +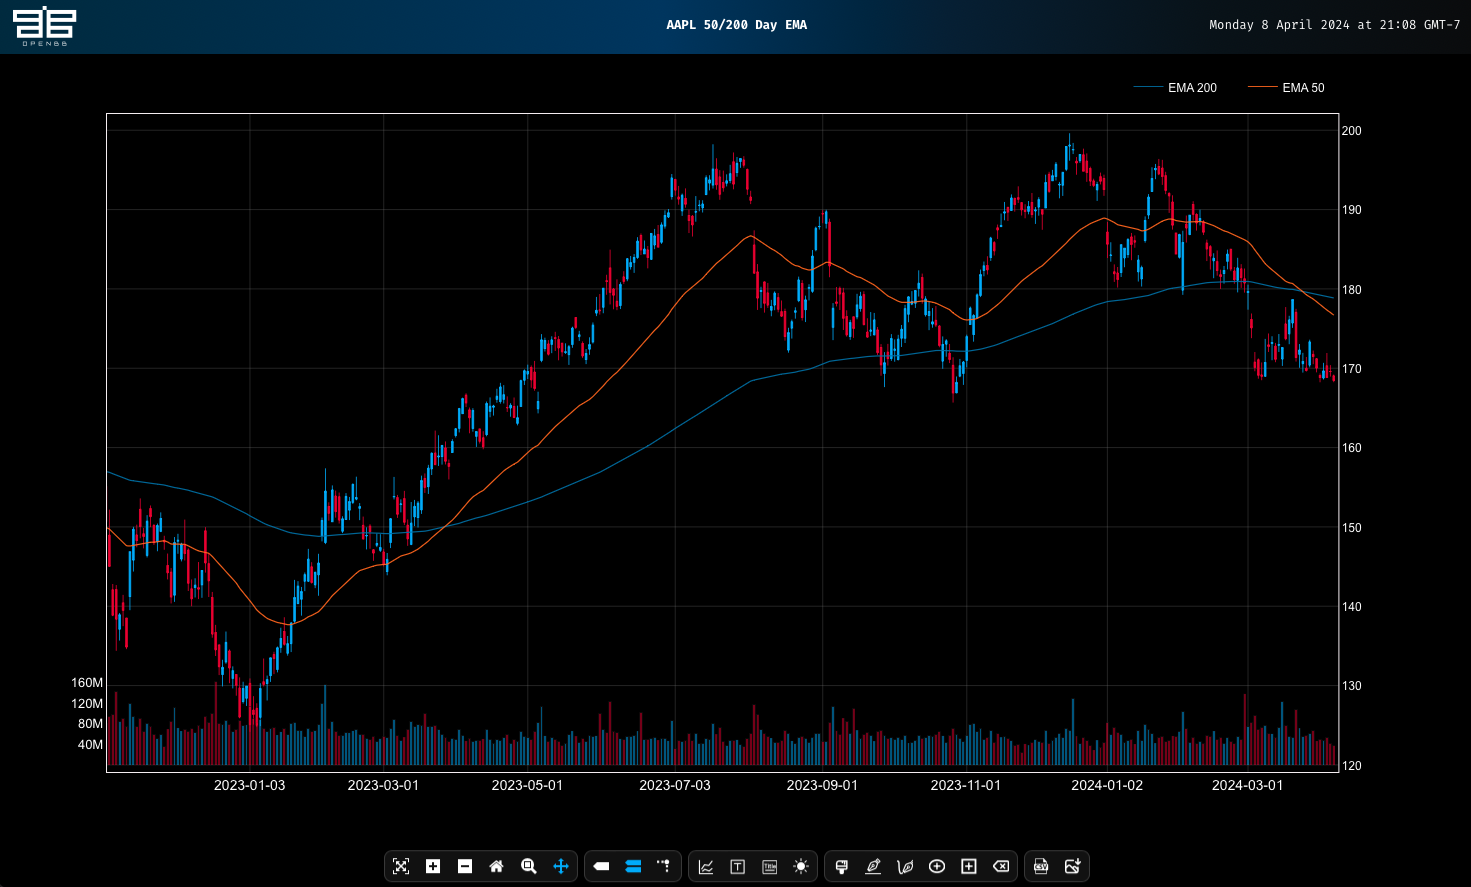 + +### No Render + +The charts can be created without opening the PyWry window, and this is the default behaviour when `chart=True`. +With the `charting.show()` and `charting.to_chart()` methods, the default is `render=True`. +Setting as `False` will return the chart to itself, populating the `chart` attribute of OBBject. + +## What Endpoints Have Charts? + +The OpenBB Platform router, open_api.json, function signatures, and documentation are all generated based on your specific configuration. When the `openbb-charting` extension is installed, any function found in the "[charting_router](https://github.com/OpenBB-finance/OpenBBTerminal/blob/develop/openbb_platform/obbject_extensions/charting/openbb_charting/charting_router.py)" adds `chart: bool = False` to the command on build. For example, `obb.index.price.historical?` + +```python +Signature: +obb.index.price.historical( + symbol: Annotated[Union[str, List[str]], OpenBBCustomParameter(description='Symbol to get data for. Multiple comma separated items allowed for provider(s): cboe, fmp, intrinio, polygon, yfinance.')], + ... + chart: typing.Annotated[bool, OpenBBCustomParameter(description='Whether to create a chart or not, by default False.')] = False, + **kwargs, +) -> openbb_core.app.model.obbject.OBBject +``` + +### Charting Functions + +The `charting` attribute of every command output has methods for identifying the charting functions and parameters. +While able to serve JSON-serializable charts, the `openbb-charting` extension is best-suited for use with the Python Interface. Much of the functionality is realized post-request. + +Examine the extension by returning any command at all. + +```python +from openbb import obb + +data = obb.equity.price.historical("SPY,QQQ,XLK,BTC-USD", provider="yfinance") + +data.charting.functions() +``` + +```console +['crypto_price_historical', + 'currency_price_historical', + 'economy_fred_series', + 'equity_price_historical', + 'equity_price_performance', + 'etf_historical', + 'etf_holdings', + 'etf_price_performance', + 'index_price_historical', + 'technical_adx', + 'technical_aroon', + 'technical_cones', + 'technical_ema', + 'technical_hma', + 'technical_macd', + 'technical_rsi', + 'technical_sma', + 'technical_wma', + 'technical_zlma'] +``` + +:::tip +The list above should, as shown here, should not be considered as the source of truth. It's just a sample. +::: + +If the `OBBject` in question has a dedicated charting function associated with it, parameters are detailed by the `get_params()` method. + +```console +EquityPriceHistoricalChartQueryParams + + Parameters + ---------- + + data : Union[Data, list[Data], NoneType] + Filtered versions of the data contained in the original `self.results`. + Columns should be the same as the original data. + Example use is to reduce the number of columns, or the length of data, to plot. + + title : Union[str, NoneType] + Title of the chart. + + target : Union[str, NoneType] + The specific column to target. + If supplied, this will override the candles and volume parameters. + + multi_symbol : bool + Flag to indicate whether the data contains multiple symbols. + This is mostly handled automatically, but if the chart fails to generate try setting this to True. + + same_axis : bool + If True, forces all data to be plotted on the same axis. + + normalize : bool + If True, the data will be normalized and placed on the same axis. + + returns : bool + If True, the cumulative returns for the length of the time series will be calculated and plotted. + + candles : bool + If True, and OHLC exists, and there is only one symbol in the data, candles will be plotted. + + heikin_ashi : bool + If True, and `candles=True`, Heikin Ashi candles will be plotted. + + volume : bool + If True, and volume exists, and `candles=True`, volume will be plotted. + + indicators : Union[ChartIndicators, dict[str, dict[str, Any]], NoneType] + Indicators to be plotted, formatted as a dictionary. + Data containing multiple symbols will ignore indicators. + Example: + indicators = dict( + sma=dict(length=[20,30,50]), + adx=dict(length=14), + rsi=dict(length=14), + ) +``` + +Not all commands will have the same `chart_params`, and some less than others, but it is always possible to redraw the chart with a different combination post-request. Here's what the default chart is from the output of the command above. + +If `chart=True` was not specified, it will need to be created. + +```python +data.charting.to_chart() +``` + +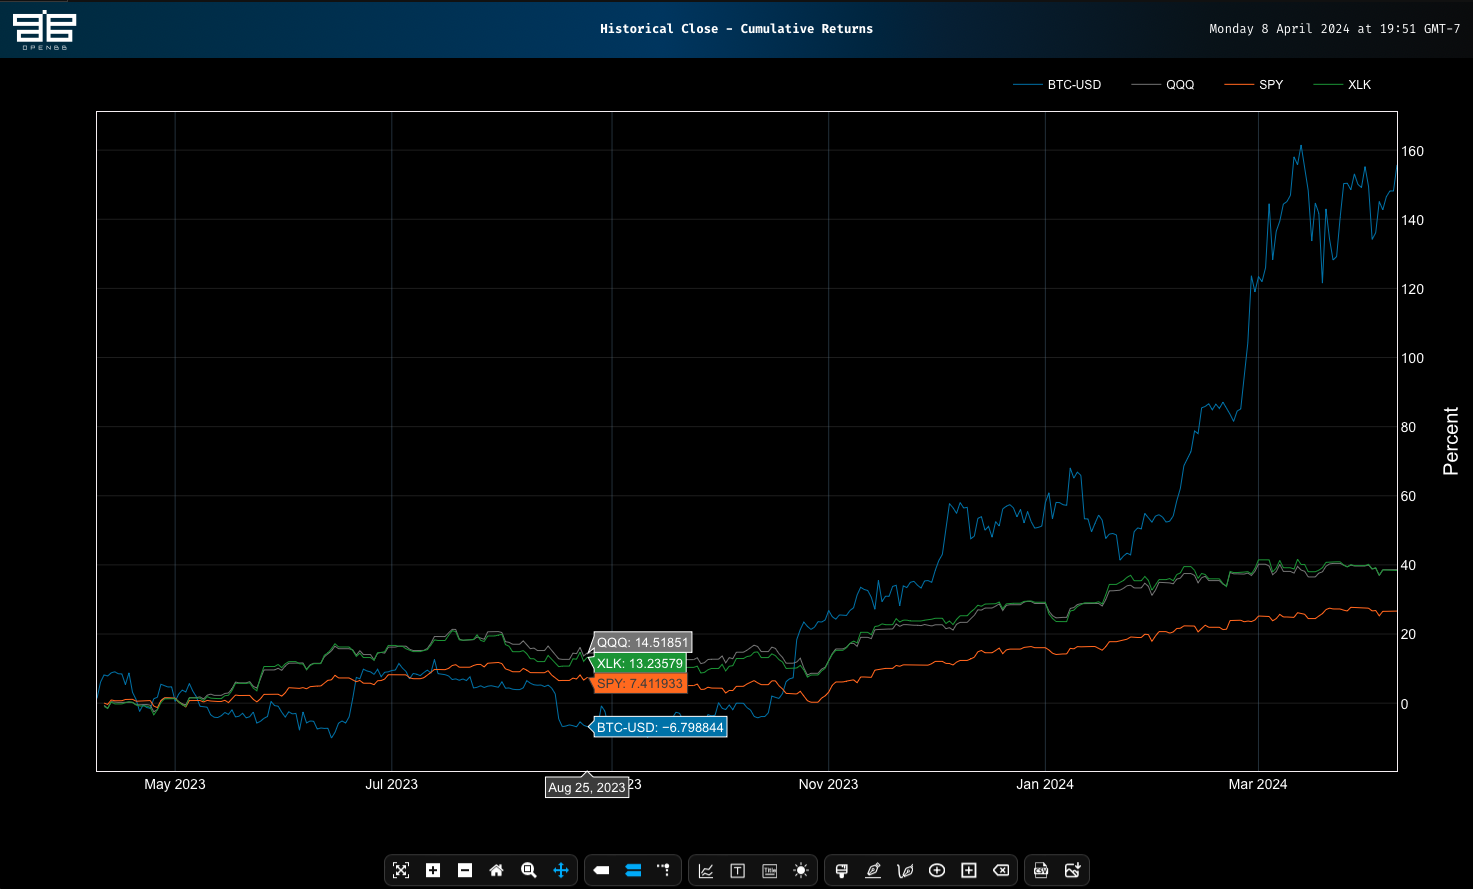 + +The extension recognized that multiple symbols were within the object, and made a determination to display cumulative returns by default. + +A candlestick chart will draw only when there is one symbol in the data. + +```python +obb.equity.price.historical( + symbol="XLK", + start_date="2024-01-01", + provider="yfinance", + chart=True, + chart_params=dict(title="XLK YTD", heikin_ashi=True) +).show() +``` + + + +## Endpoints Without Charts + +Most functions do not have dedicated charts. However, it's still possible to generate one automatically. Using the `data` above, we can try passing it through a quantitative analysis command. + +```python +data = obb.equity.price.historical( + symbol="XLK", + start_date="2023-01-01", + provider="yfinance", +) +qa = obb.quantitative.rolling.stdev(data.results, target="close") + +qa.charting.show(title="XLK Rolling 21 Day Standard Deviation") +``` + + + +## Charts From Any Data + +There are methods for creating a generic chart from any external data. +They will bypass any data contained in the parent object, unless specifically fed into itself. + +- charting.create_bar_chart() +- charting.create_line_chart() + +They can also be used as standalone components by initializing an empty instance of the OBBject class. + +```python +from openbb import obb +from openbb_core.app.model.obbject import OBBject +create_bar_chart = OBBject(results=None).charting.create_bar_chart + +create_bar_chart? +```` + +```console +Create a bar chart on a single x-axis with one or more values for the y-axis. + +Parameters +---------- +data : Union[list, dict, pd.DataFrame, List[pd.DataFrame], pd.Series, List[pd.Series], np.ndarray, Data] + Data to plot. +x : str + The x-axis column name. +y : Union[str, List[str]] + The y-axis column name(s). +barmode : Literal["group", "stack", "relative", "overlay"], optional + The bar mode, by default "group". +xtype : Literal["category", "multicategory", "date", "log", "linear"], optional + The x-axis type, by default "category". +title : Optional[str], optional + The title of the chart, by default None. +xtitle : Optional[str], optional + The x-axis title, by default None. +ytitle : Optional[str], optional + The y-axis title, by default None. +orientation : Literal["h", "v"], optional + The orientation of the chart, by default "v". +colors: Optional[List[str]], optional + Manually set the colors to cycle through for each column in 'y', by default None. +layout_kwargs : Optional[Dict[str, Any]], optional + Additional keyword arguments to apply with figure.update_layout(), by default None. + +Returns +------- +OpenBBFigure + The OpenBBFigure object. +``` + +## Tables + +The `openbb-charting` extension is equipped with interactive tables, utilizing the React framework. They are displayed by using the `table` method. + +```python +data = obb.equity.price.quote("AAPL,MSFT,GOOGL,META,TSLA,AMZN", provider="yfinance") +data.charting.table() +``` +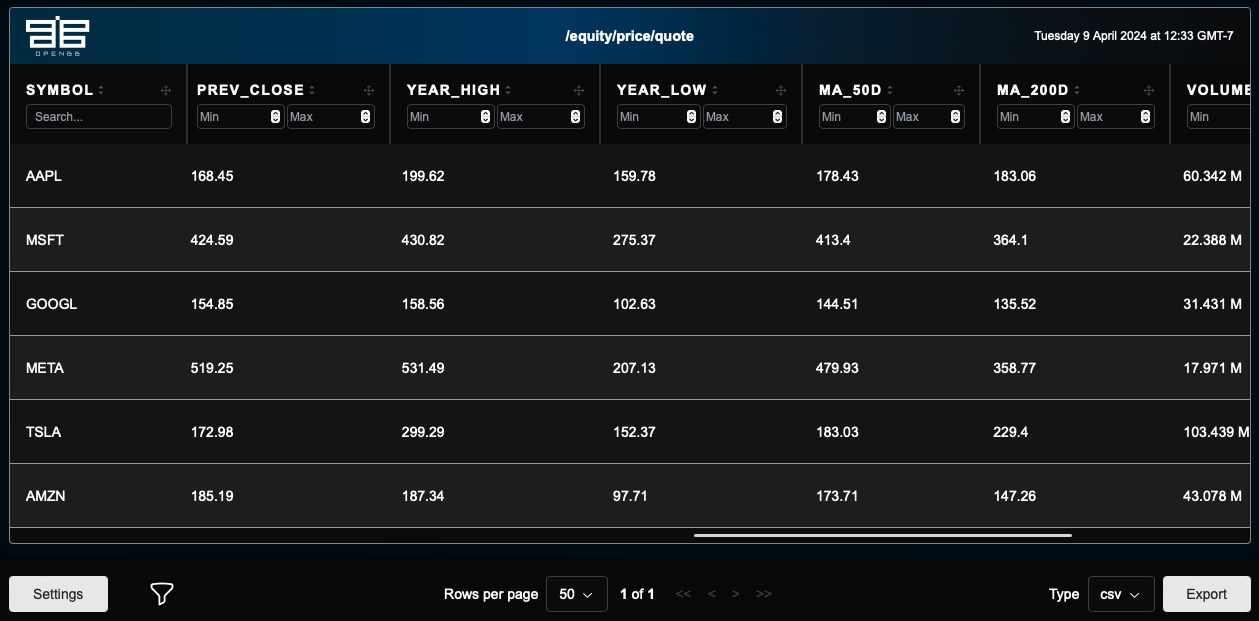 + +External data can also be supplied, providing an opportunity to filter or apply Pandas operations before display. + +``` +new_df = df.to_df().T +new_df.index.name="metric" +new_df.columns = new_df.loc["symbol"] +new_df.drop("symbol", inplace=True) +data.charting.table(data=new_df) +``` + +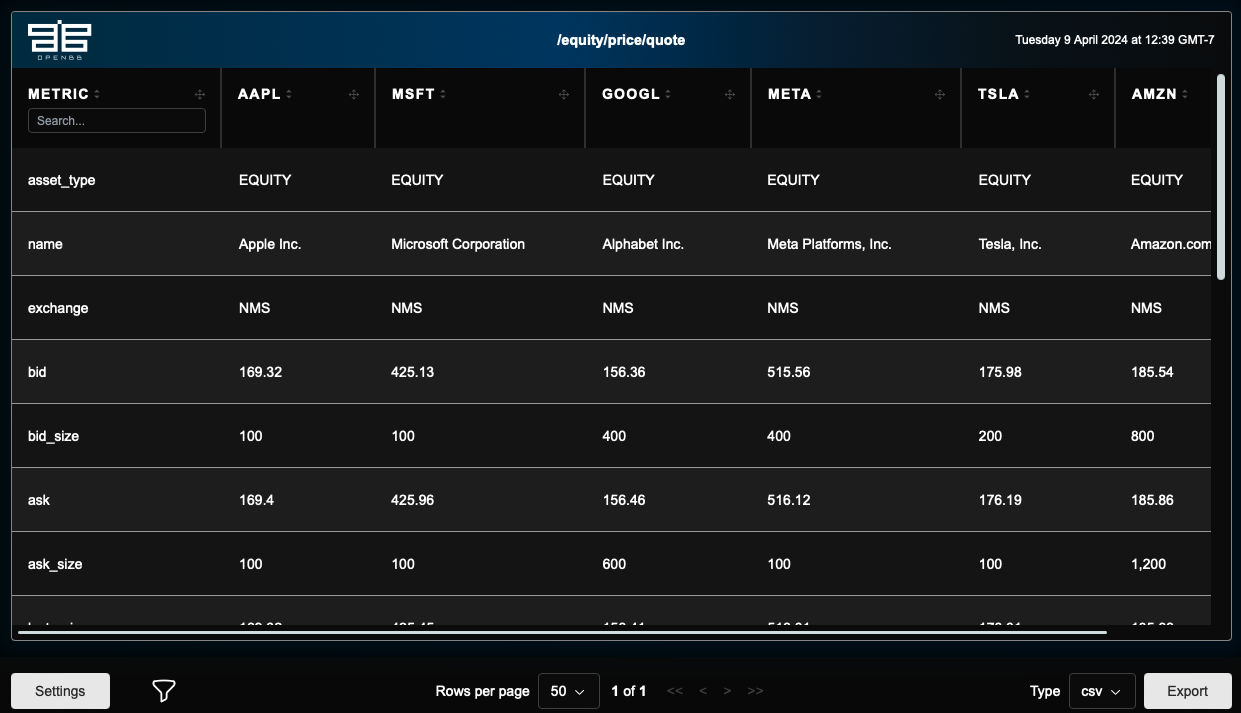 + +:::important +This does not alter the contents of the original object, the displayed data is a copy. +::: diff --git a/website/content/platform/extensions/charting/indicators.md b/website/content/platform/extensions/charting/indicators.md new file mode 100644 index 00000000000..9966ba4571f --- /dev/null +++ b/website/content/platform/extensions/charting/indicators.md @@ -0,0 +1,384 @@ +--- +title: Indicators +sidebar_position: 2 +description: A tutorial of the technical indicators included with the openbb-charting library, including how to get started using them. +keywords: +- tutorial +- OpenBB Platform +- getting started +- extensions +- charting +- view +- Plotly +- toolkits +- indicators +- Plotly +- OpenBBFigure +- PyWry +--- + +import HeadTitle from '@site/src/components/General/HeadTitle.tsx'; + +<HeadTitle title="Indicators - OpenBB Charting - Extensions | OpenBB Platform Docs" /> + +## Introduction + +Select indicators (technical) can be added to a chart where the data is OHLC+V prices over time, and the data is for one symbol only. +They are meant as quick visualizations, and a way to build more complex charts. +As starting points, they can be refined to perfection by manipulating the figure object directly. + +```python +from datetime import datetime, timedelta +from openbb import obb +data = obb.equity.price.historical( + "TSLA", + provider="yfinance", + interval="15m", + start_date=(datetime.now()-timedelta(days=21)).date(), + chart=True, + chart_params=dict( + heikin_ashi=True, + indicators=(dict( + ema=dict(length=[8,32]), + srlines={}, # For indicators, an empty dictionary implies the default state. + rsi=dict(length=32) + )) + ) +) +data.show() +``` + + + +## Available Indicators + +To get all the indicators, use the `charting.indicators()` method. +The object returned is a Pydantic model where each indicator is field. +If you don't catch it, it will print as a docstring to the console. + +:::danger +Some indicators, like RSI and MACD, create subplots. Only 4 subplots (not including the main candles + volume) can be created within the same view. +::: + +```python +data.charting.indicators() +``` + +```console +SMA: + + Parameters + ---------- + + length : Union[int, list[int]] + Window length for the moving average, by default is 50. + The number is relative to the interval of the time series data. + + offset : int + Number of periods to offset for the moving average, by default is 0. + +EMA: + + Parameters + ---------- + + length : Union[int, list[int]] + Window length for the moving average, by default is 50. + The number is relative to the interval of the time series data. + + offset : int + Number of periods to offset for the moving average, by default is 0. + +HMA: + + Parameters + ---------- + + length : Union[int, list[int]] + Window length for the moving average, by default is 50. + The number is relative to the interval of the time series data. + + offset : int + Number of periods to offset for the moving average, by default is 0. + +WMA: + + Parameters + ---------- + + length : Union[int, list[int]] + Window length for the moving average, by default is 50. + The number is relative to the interval of the time series data. + + offset : int + Number of periods to offset for the moving average, by default is 0. + +ZLMA: + + Parameters + ---------- + + length : Union[int, list[int]] + Window length for the moving average, by default is 50. + The number is relative to the interval of the time series data. + + offset : int + Number of periods to offset for the moving average, by default is 0. + +AD: + + Parameters + ---------- + + offset : int + Offset value for the AD, by default is 0. + +AD Oscillator: + + Parameters + ---------- + + fast : int + Number of periods to use for the fast calculation, by default 3. + + slow : int + Number of periods to use for the slow calculation, by default 10. + + offset : int + Offset to be used for the calculation, by default is 0. + +ADX: + + Parameters + ---------- + + length : int + Window length for the ADX, by default is 50. + + scalar : float + Scalar to multiply the ADX by, default is 100. + + drift : int + Drift value for the ADX, by default is 1. + +Aroon: + + Parameters + ---------- + + length : int + Window length for the Aroon, by default is 50. + + scalar : float + Scalar to multiply the Aroon by, default is 100. + +ATR: + + Parameters + ---------- + + length : int + Window length for the ATR, by default is 14. + + mamode : Literal[rma, ema, sma, wma] + The mode to use for the moving average calculation. + + drift : int + The difference period. + + offset : int + Number of periods to offset the result, by default is 0. + +CCI: + + Parameters + ---------- + + length : int + Window length for the CCI, by default is 14. + + scalar : float + Scalar to multiply the CCI by, default is 0.015. + +Clenow: + + Parameters + ---------- + + period : int + The number of periods for the momentum, by default 90. + +Demark: + + Parameters + ---------- + + show_all : bool + Show 1 - 13. + If set to False, show 6 - 9. + + offset : int + Number of periods to offset the result, by default is 0. + +Donchian: + + Parameters + ---------- + + lower : Union[int, NoneType] + Window length for the lower band, by default is 20. + + upper : Union[int, NoneType] + Window length for the upper band, by default is 20. + + offset : Union[int, NoneType] + Number of periods to offset the result, by default is 0. + +Fib: + + Parameters + ---------- + + period : int + The period to calculate the Fibonacci Retracement, by default 120. + + start_date : Union[str, NoneType] + The start date for the Fibonacci Retracement. + + end_date : Union[str, NoneType] + The end date for the Fibonacci Retracement. + +Fisher: + + Parameters + ---------- + + length : int + Window length for the Fisher Transform, by default is 14. + + signal : int + Fisher Signal Period + +Ichimoku: + + Parameters + ---------- + + conversion : int + The conversion line period, by default 9. + + base : int + The base line period, by default 26. + + lagging : int + The lagging line period, by default 52. + + offset : int + The offset period, by default 26. + + lookahead : bool + Drops the Chikou Span Column to prevent potential data leak + +KC: + + Parameters + ---------- + + length : int + Window length for the Keltner Channel, by default is 20. + + scalar : float + Scalar to multiply the ATR, by default is 2. + + mamode : Literal[ema, sma, wma, hna, zlma, rma] + The mode to use for the moving average calculation, by default is ema. + + offset : int + Number of periods to offset the result, by default is 0. + +MACD: + + Parameters + ---------- + + fast : Union[int, NoneType] + Window length for the fast EMA, by default is 12. + + slow : Union[int, NoneType] + Window length for the slow EMA, by default is 26. + + signal : Union[int, NoneType] + Window length for the signal line, by default is 9. + + scalar : Union[float, NoneType] + Scalar to multiply the MACD by, default is 100. + +OBV: + + Parameters + ---------- + + offset : int + Number of periods to offset the result, by default is 0. + +RSI: + + Parameters + ---------- + + length : int + Window length for the RSI, by default is 14. + + scalar : float + Scalar to multiply the RSI by, default is 100. + + drift : int + Drift value for the RSI, by default is 1. + +SRLines: + + Parameters + ---------- + + show : bool + Show the support and resistance lines. + +Stoch: + + Parameters + ---------- + + fast_k : int + The fast K period, by default 14. + + slow_d : int + The slow D period, by default 3. + + slow_k : int + The slow K period, by default 3. +``` + +The model can be converted to a dictionary and then passed through the `indicators` params. + +The chart below is built from the same object as the one above. + +```python +indicators = data.charting.indicators().dict() +macd=indicators.get("macd") +kc=indicators.get("kc") +chart_params=dict( + candles=False, + title="My New Chart", + indicators=(dict( + macd=macd, + kc=kc, + )) +) +data.charting.to_chart(**chart_params) +``` + +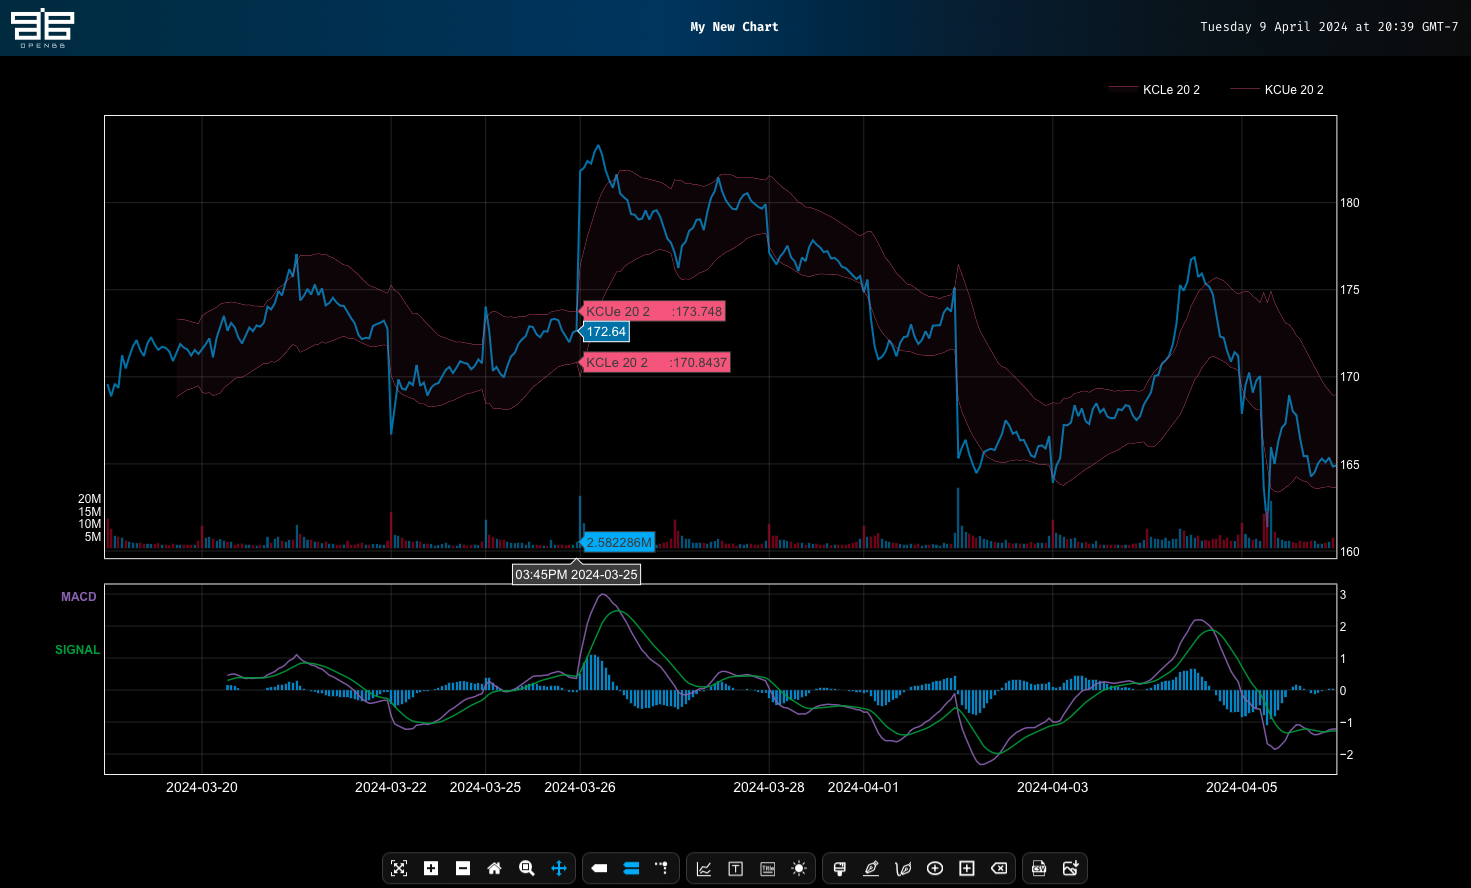 + |